9 bTB case numbers, aggregated Poisson/negative binomial models
10 Introduction
Here, we are exploring an aggregated Poisson model of bTB cases per year. Its a crude but useful approach to explore incidence risk ratios over time.
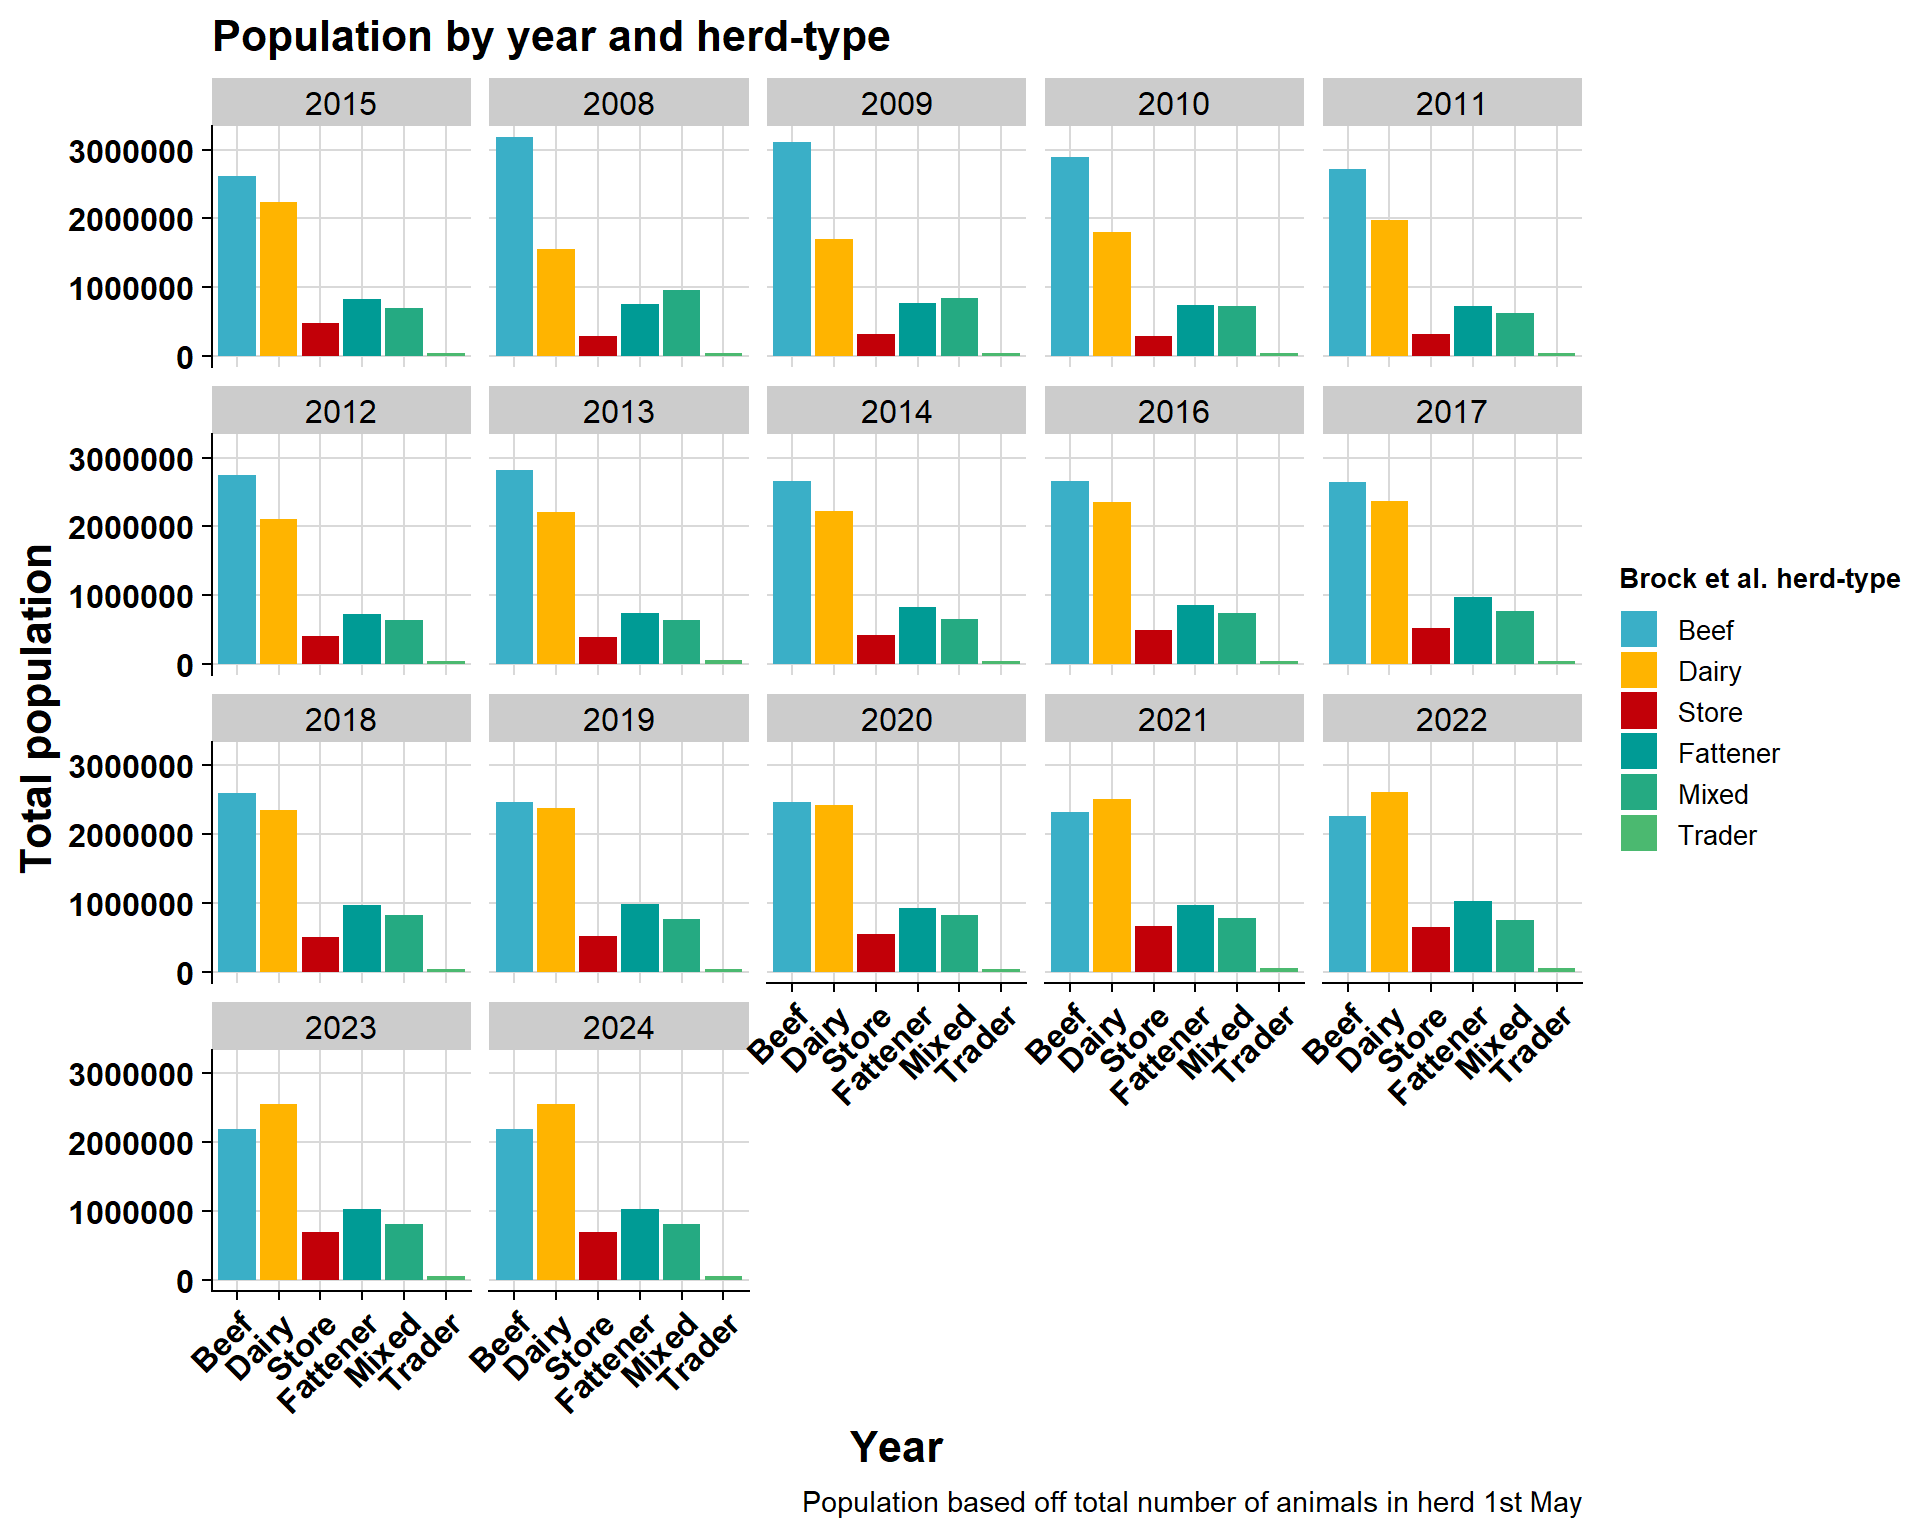
As reminder of cases and population (based on AIM data on 1st May), below are some plots. Naturally, population is problematic for trader herds as the population is fluctuating a lot more than for the other herd types as animals are constantly coming and going.
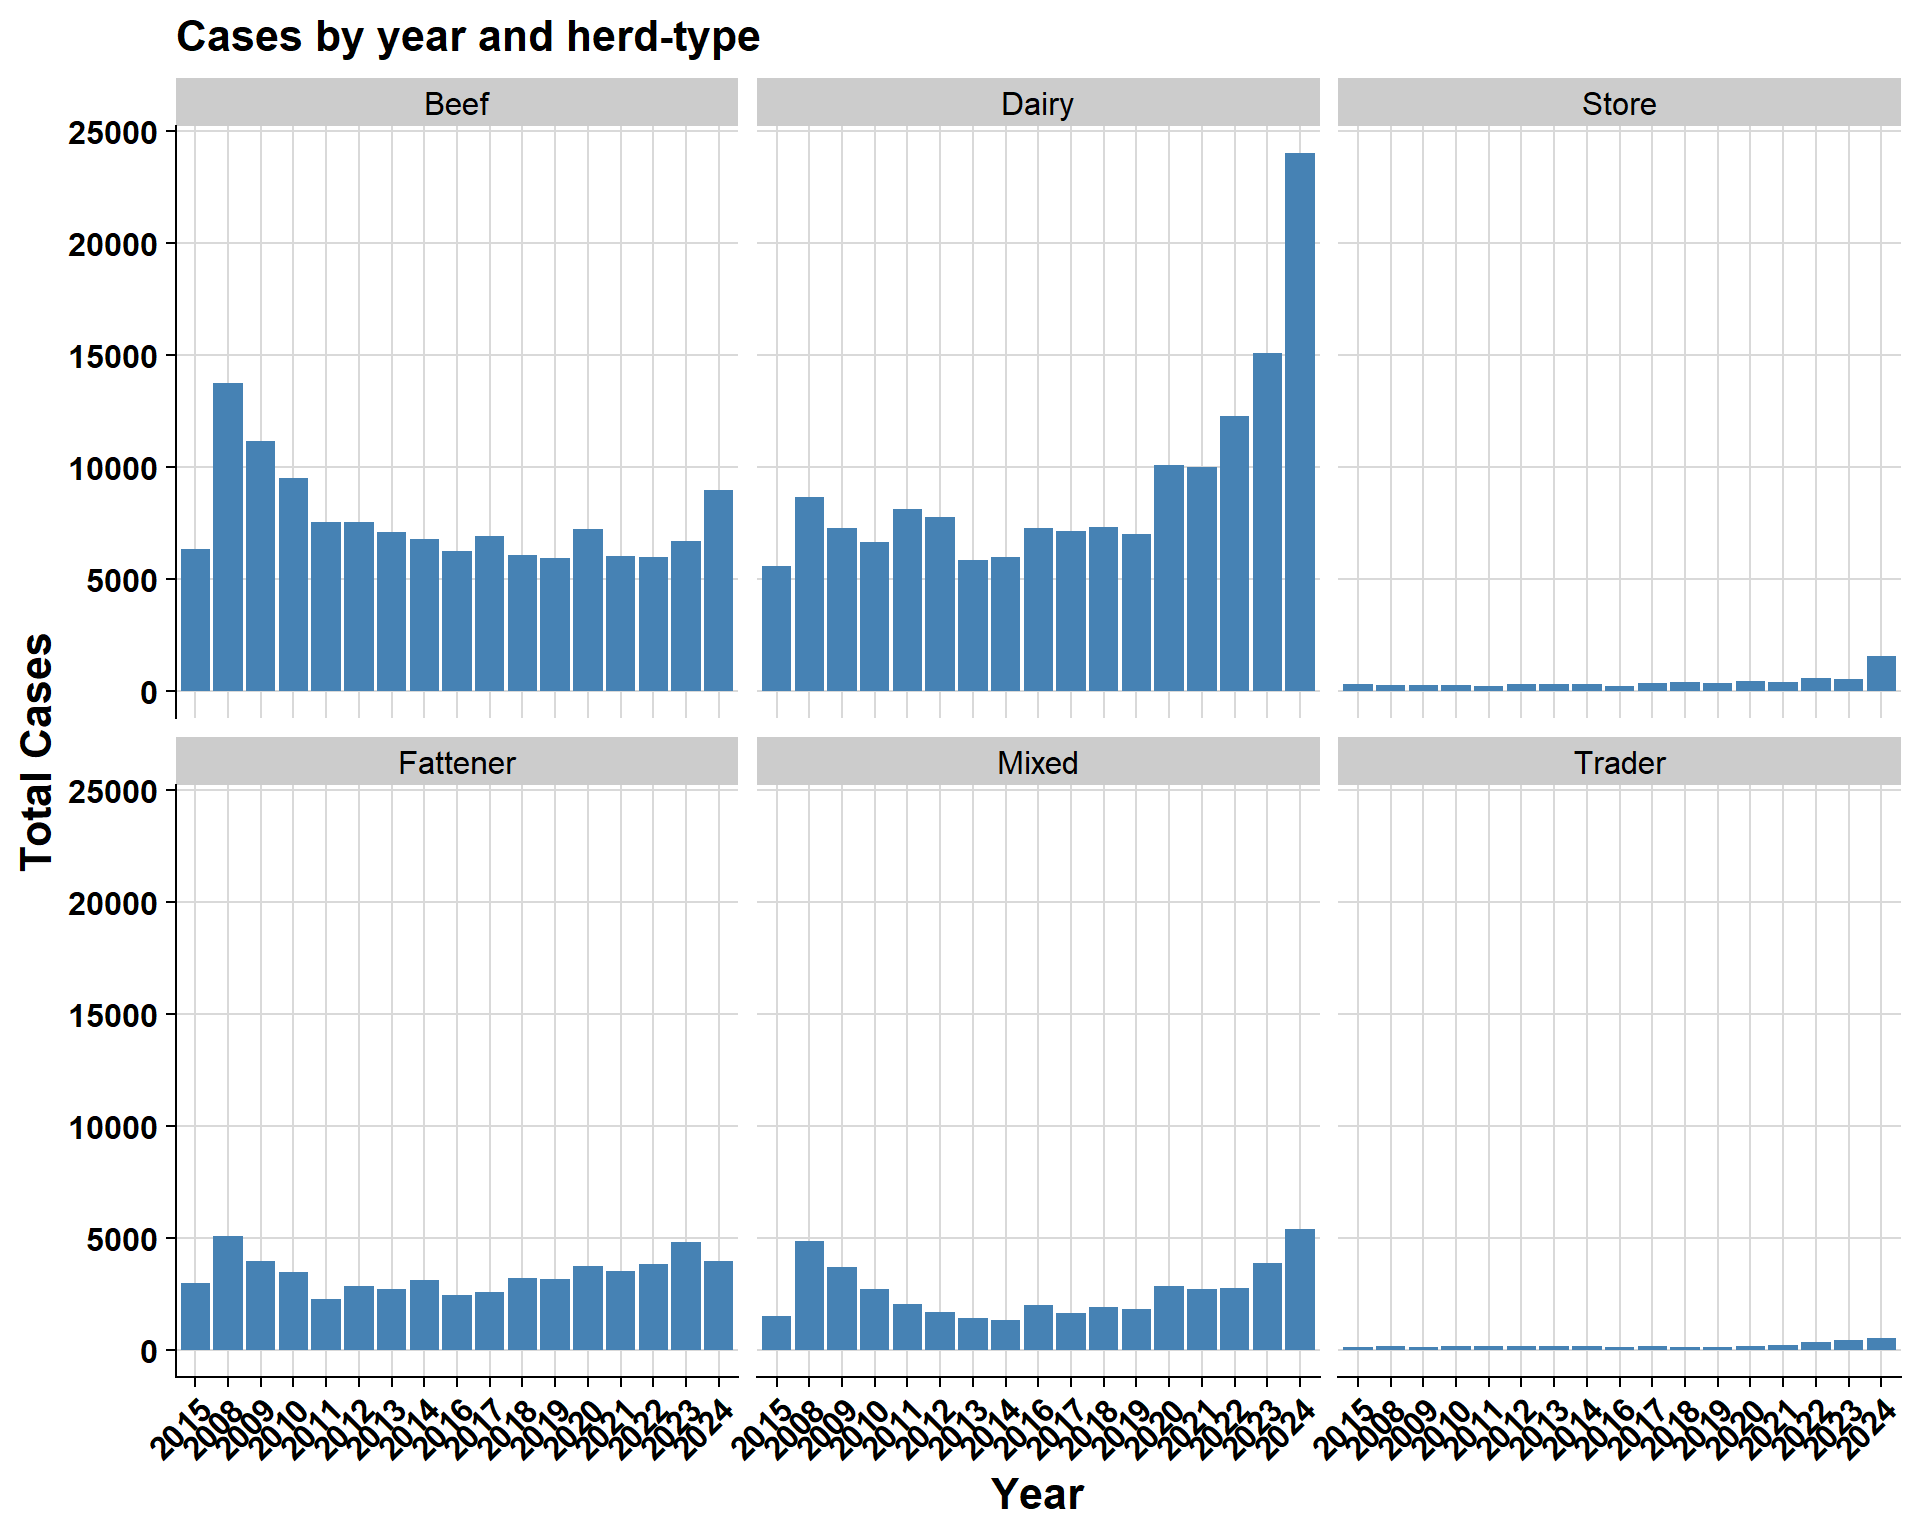
10.1 Cases over time
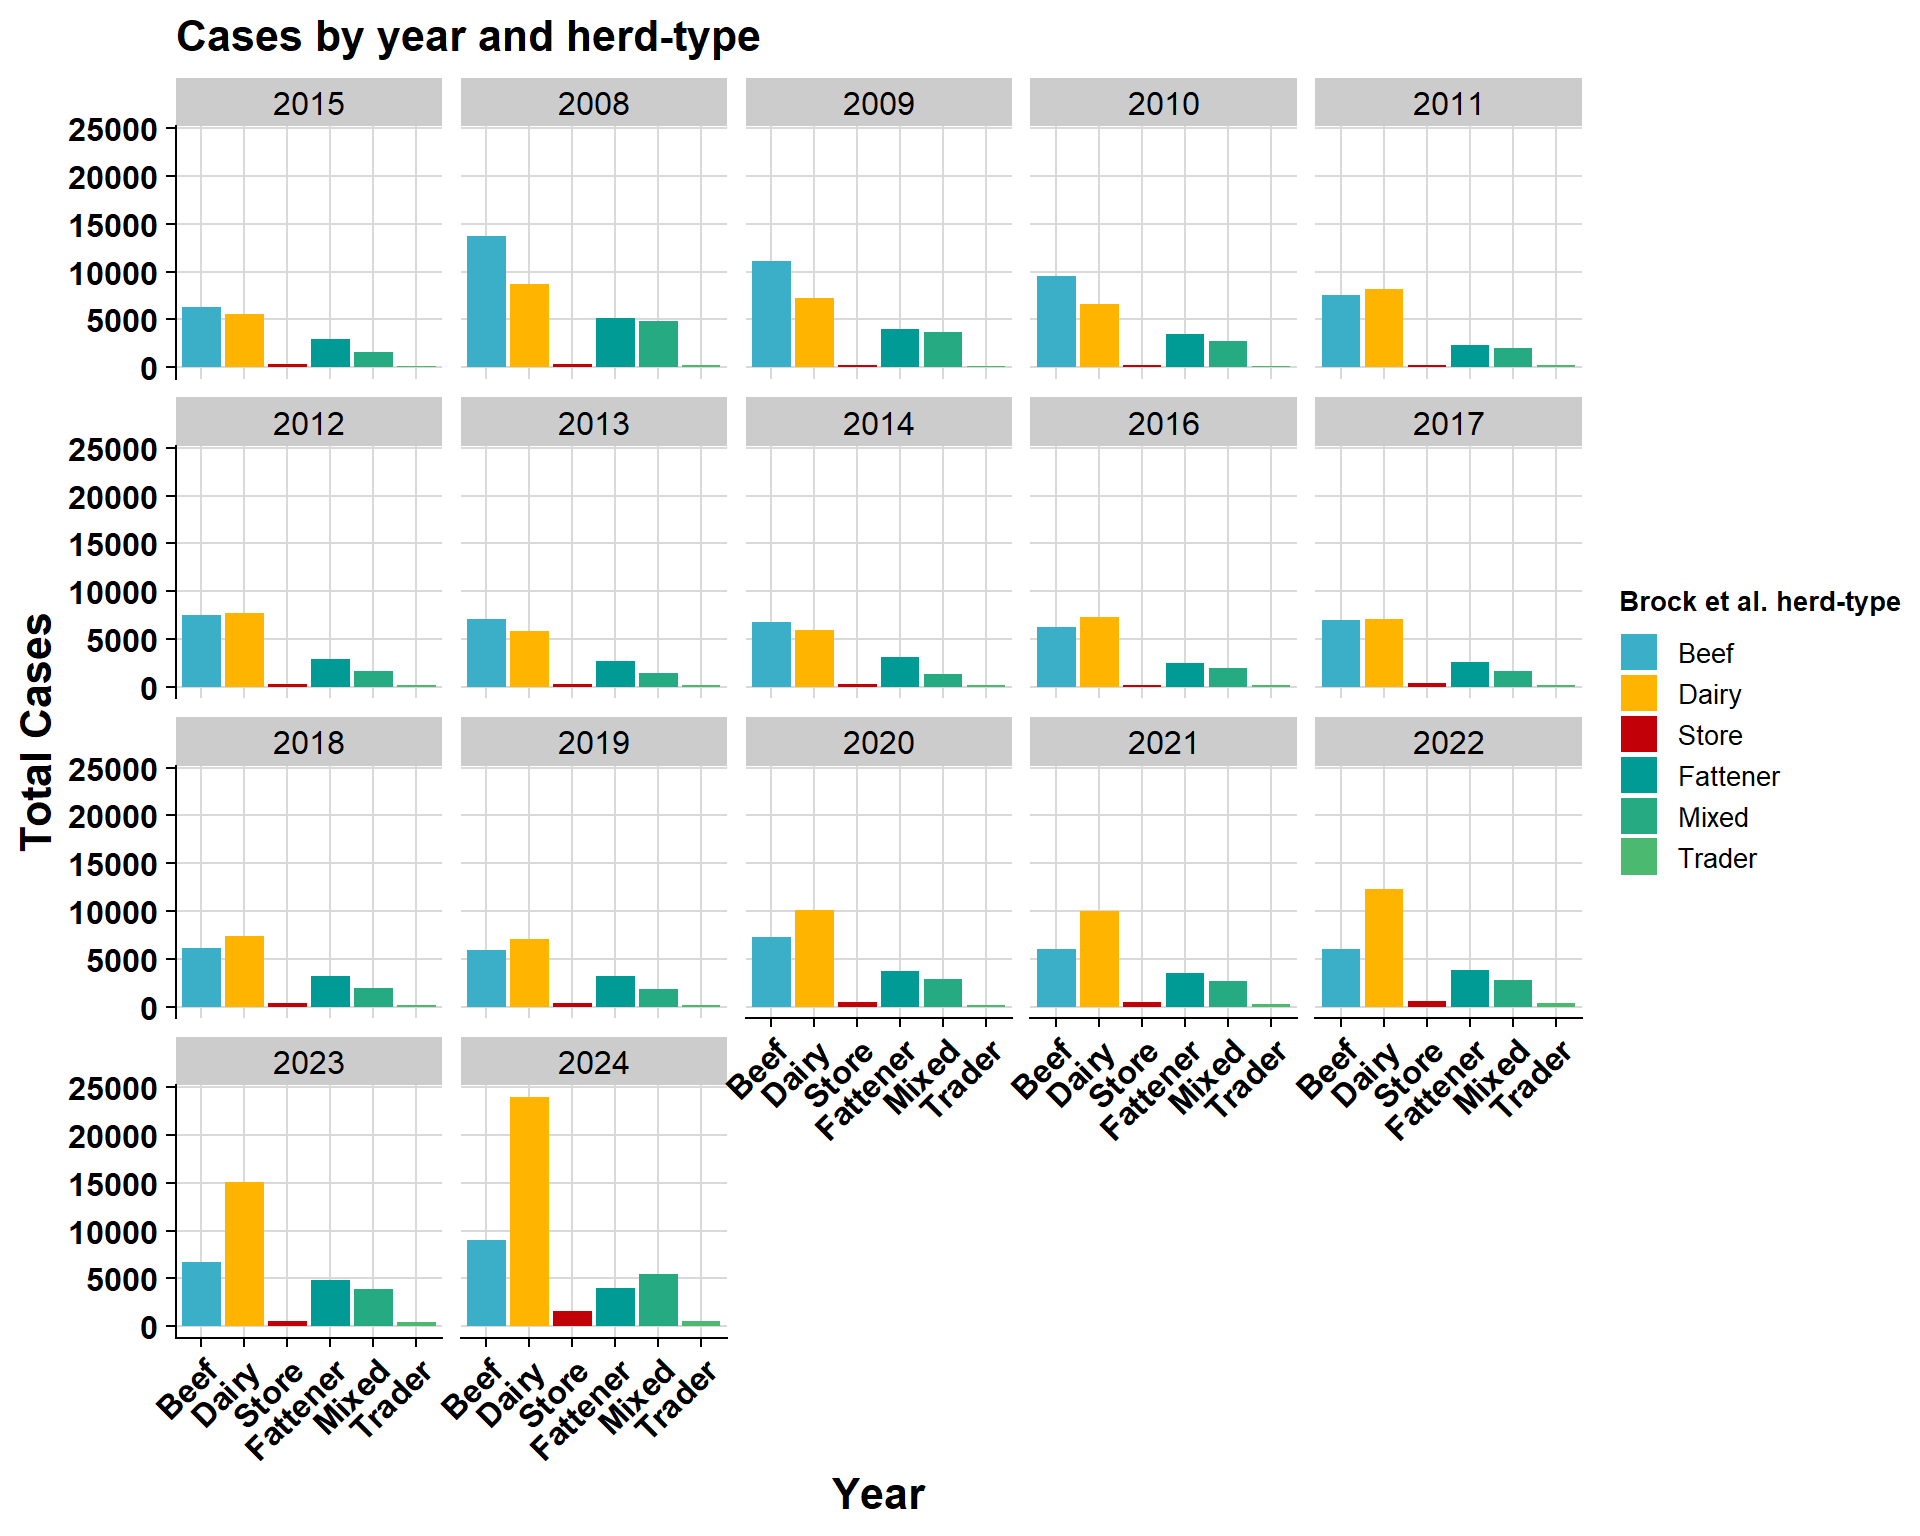
10.2 Population:
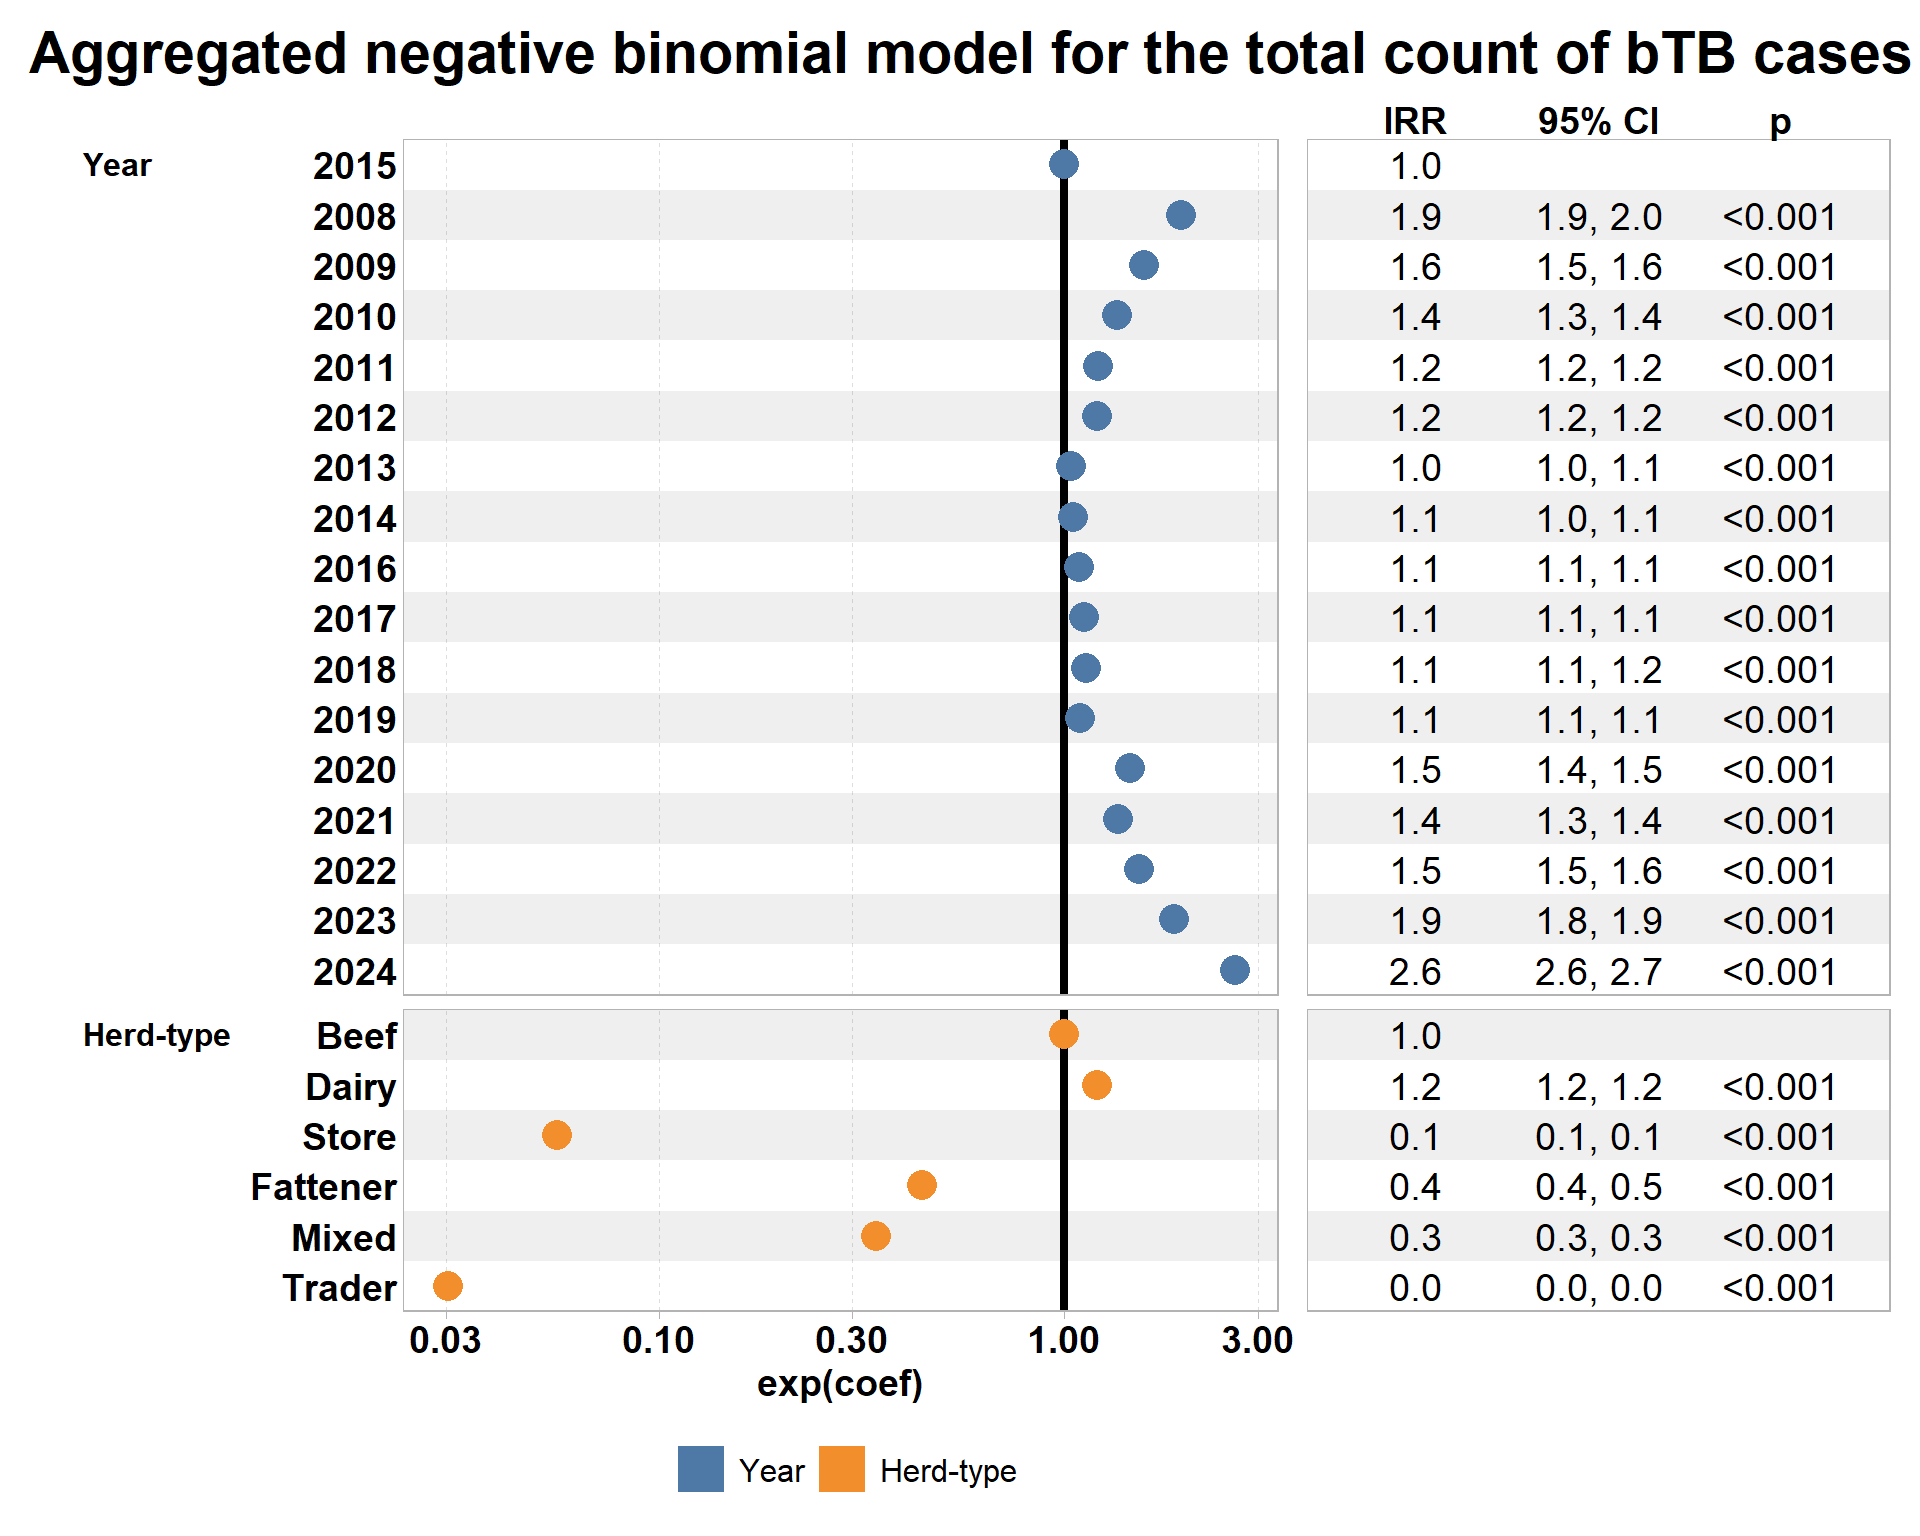
11 Poisson models
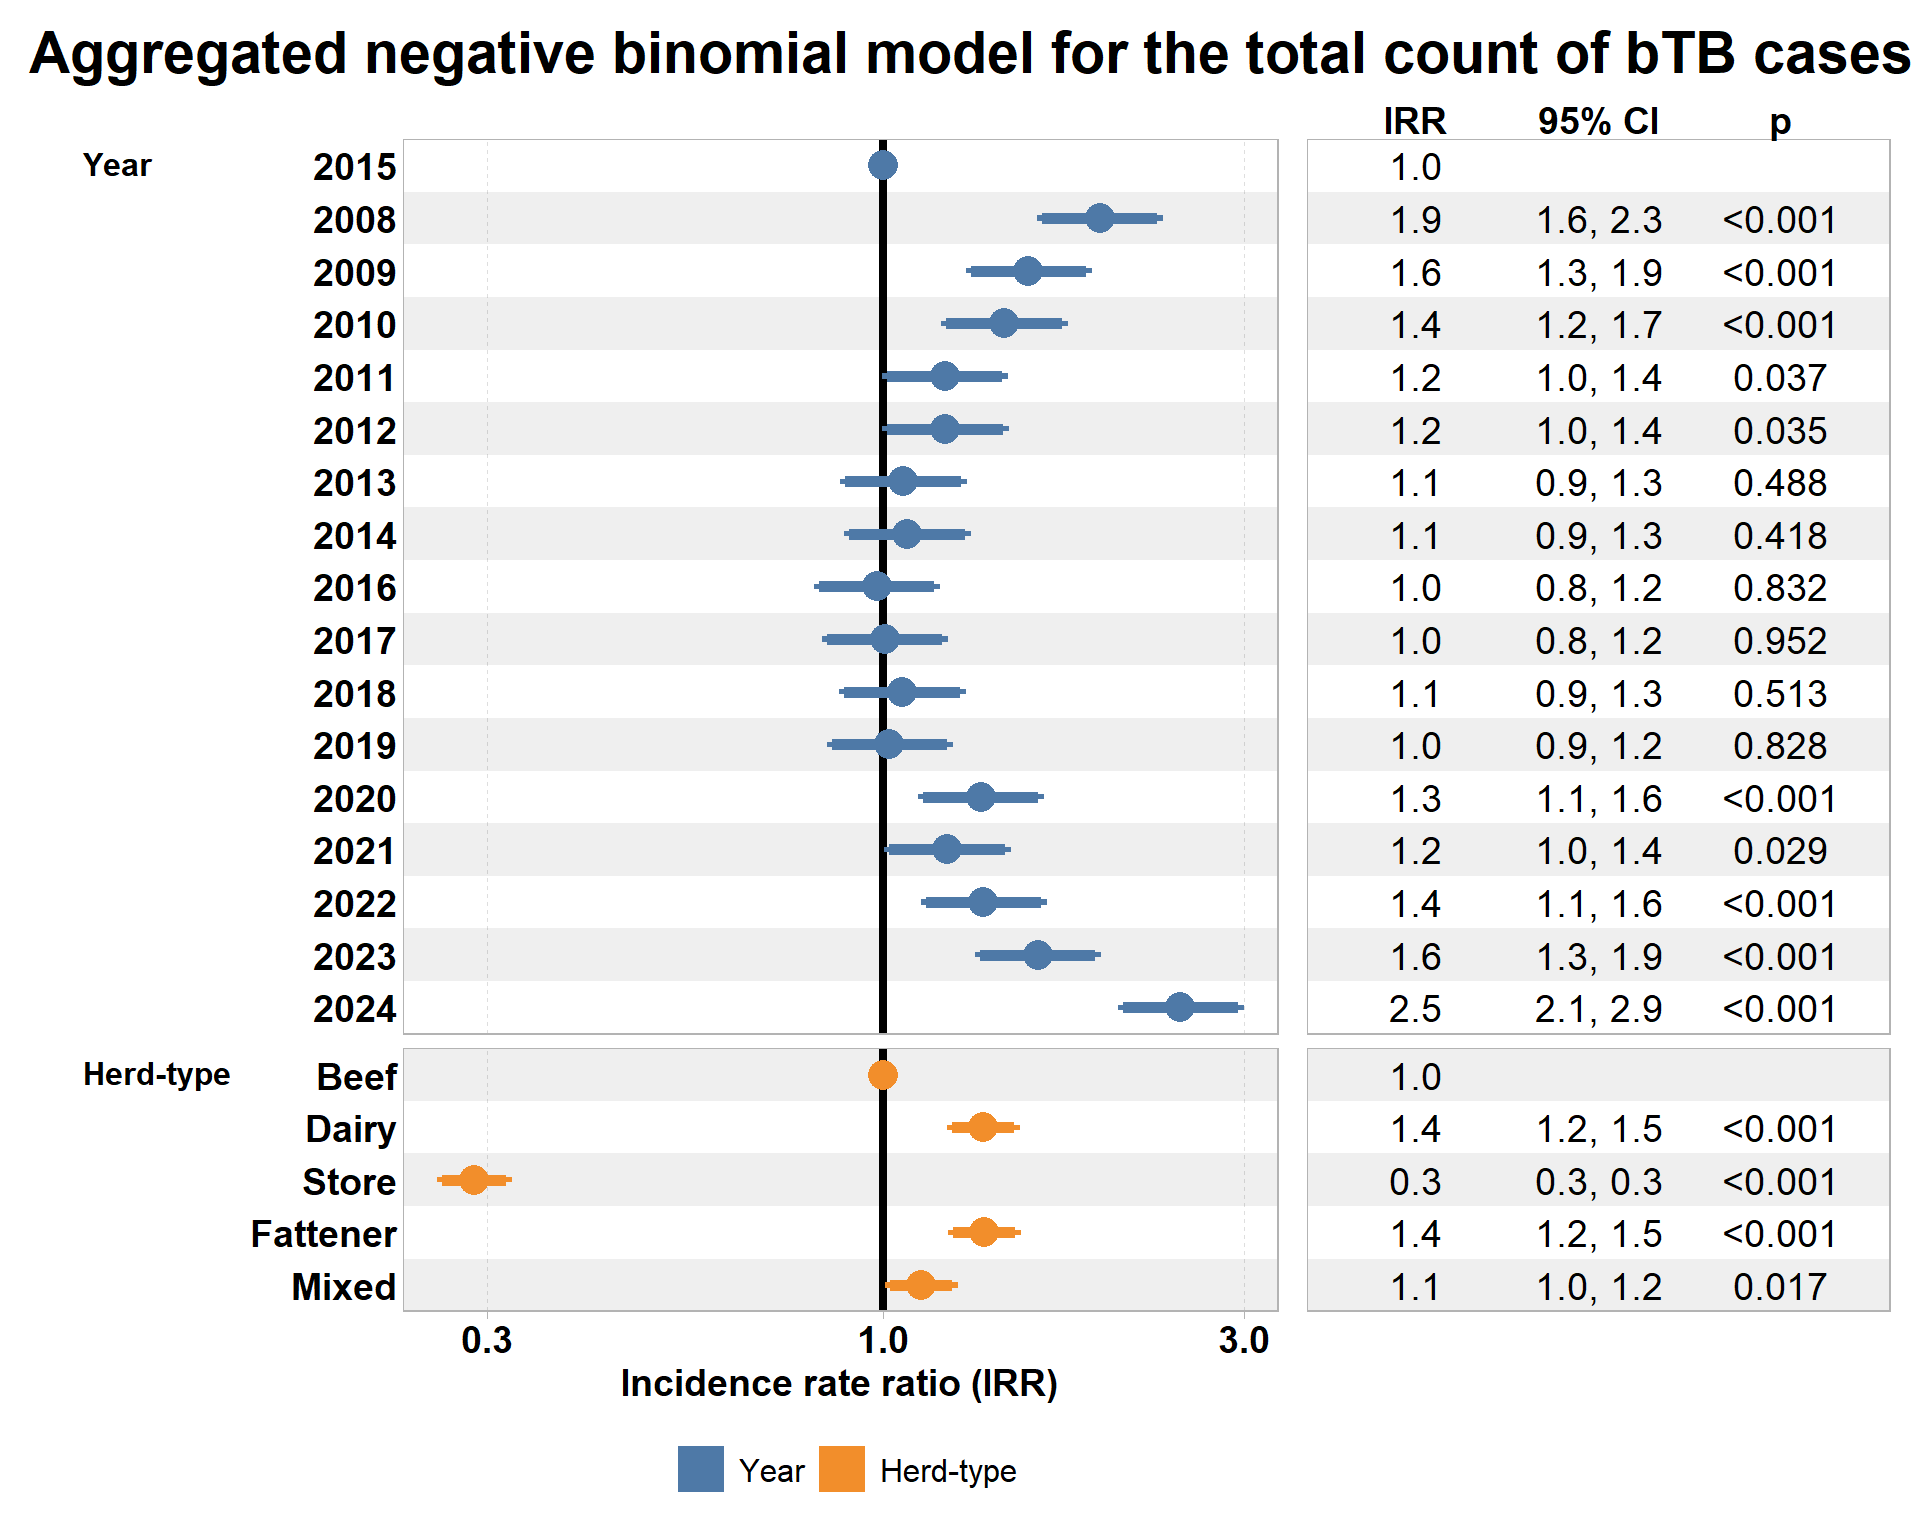
In this first model, I include herd type and year as covariates.
Next, to adjust for counts of events over time, we included an offset term based on population to focus on rates (instead of counts).
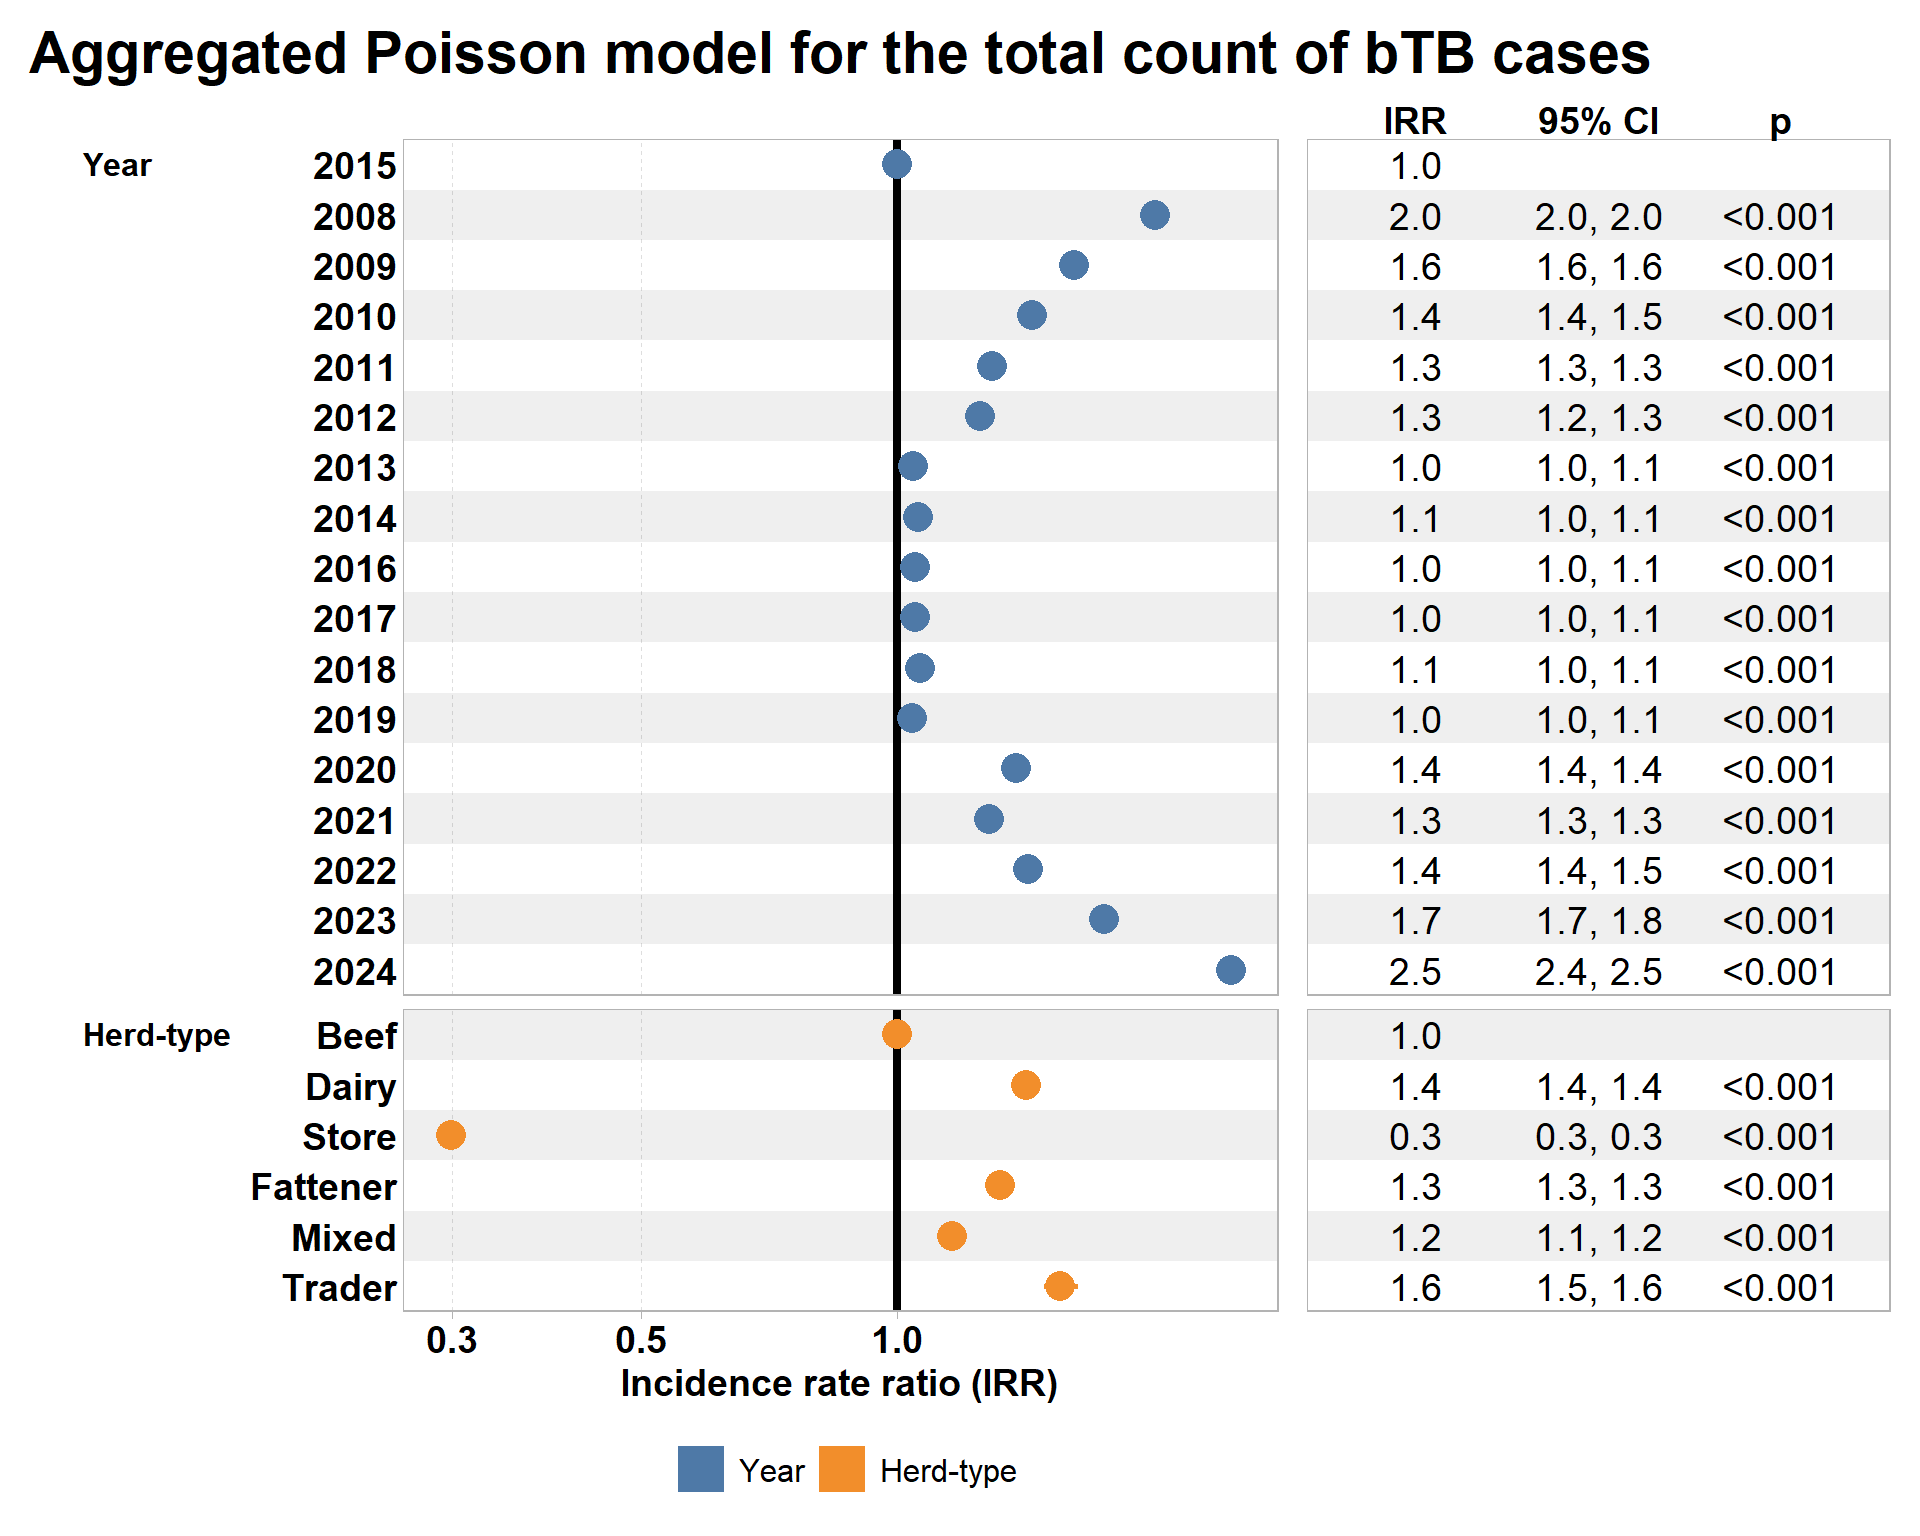
Its now really interesting that trader herds are positively significant with a large effect size. It suggests that there are a lot of bTB cases in trader herds considering their population.
11.1 Combined offset
Above we included population as an offset. However, for curiosity, we included a double offset below, not only accounting for population but also the number of tests (at animal level) conducted in the year (based solely on SICTT):
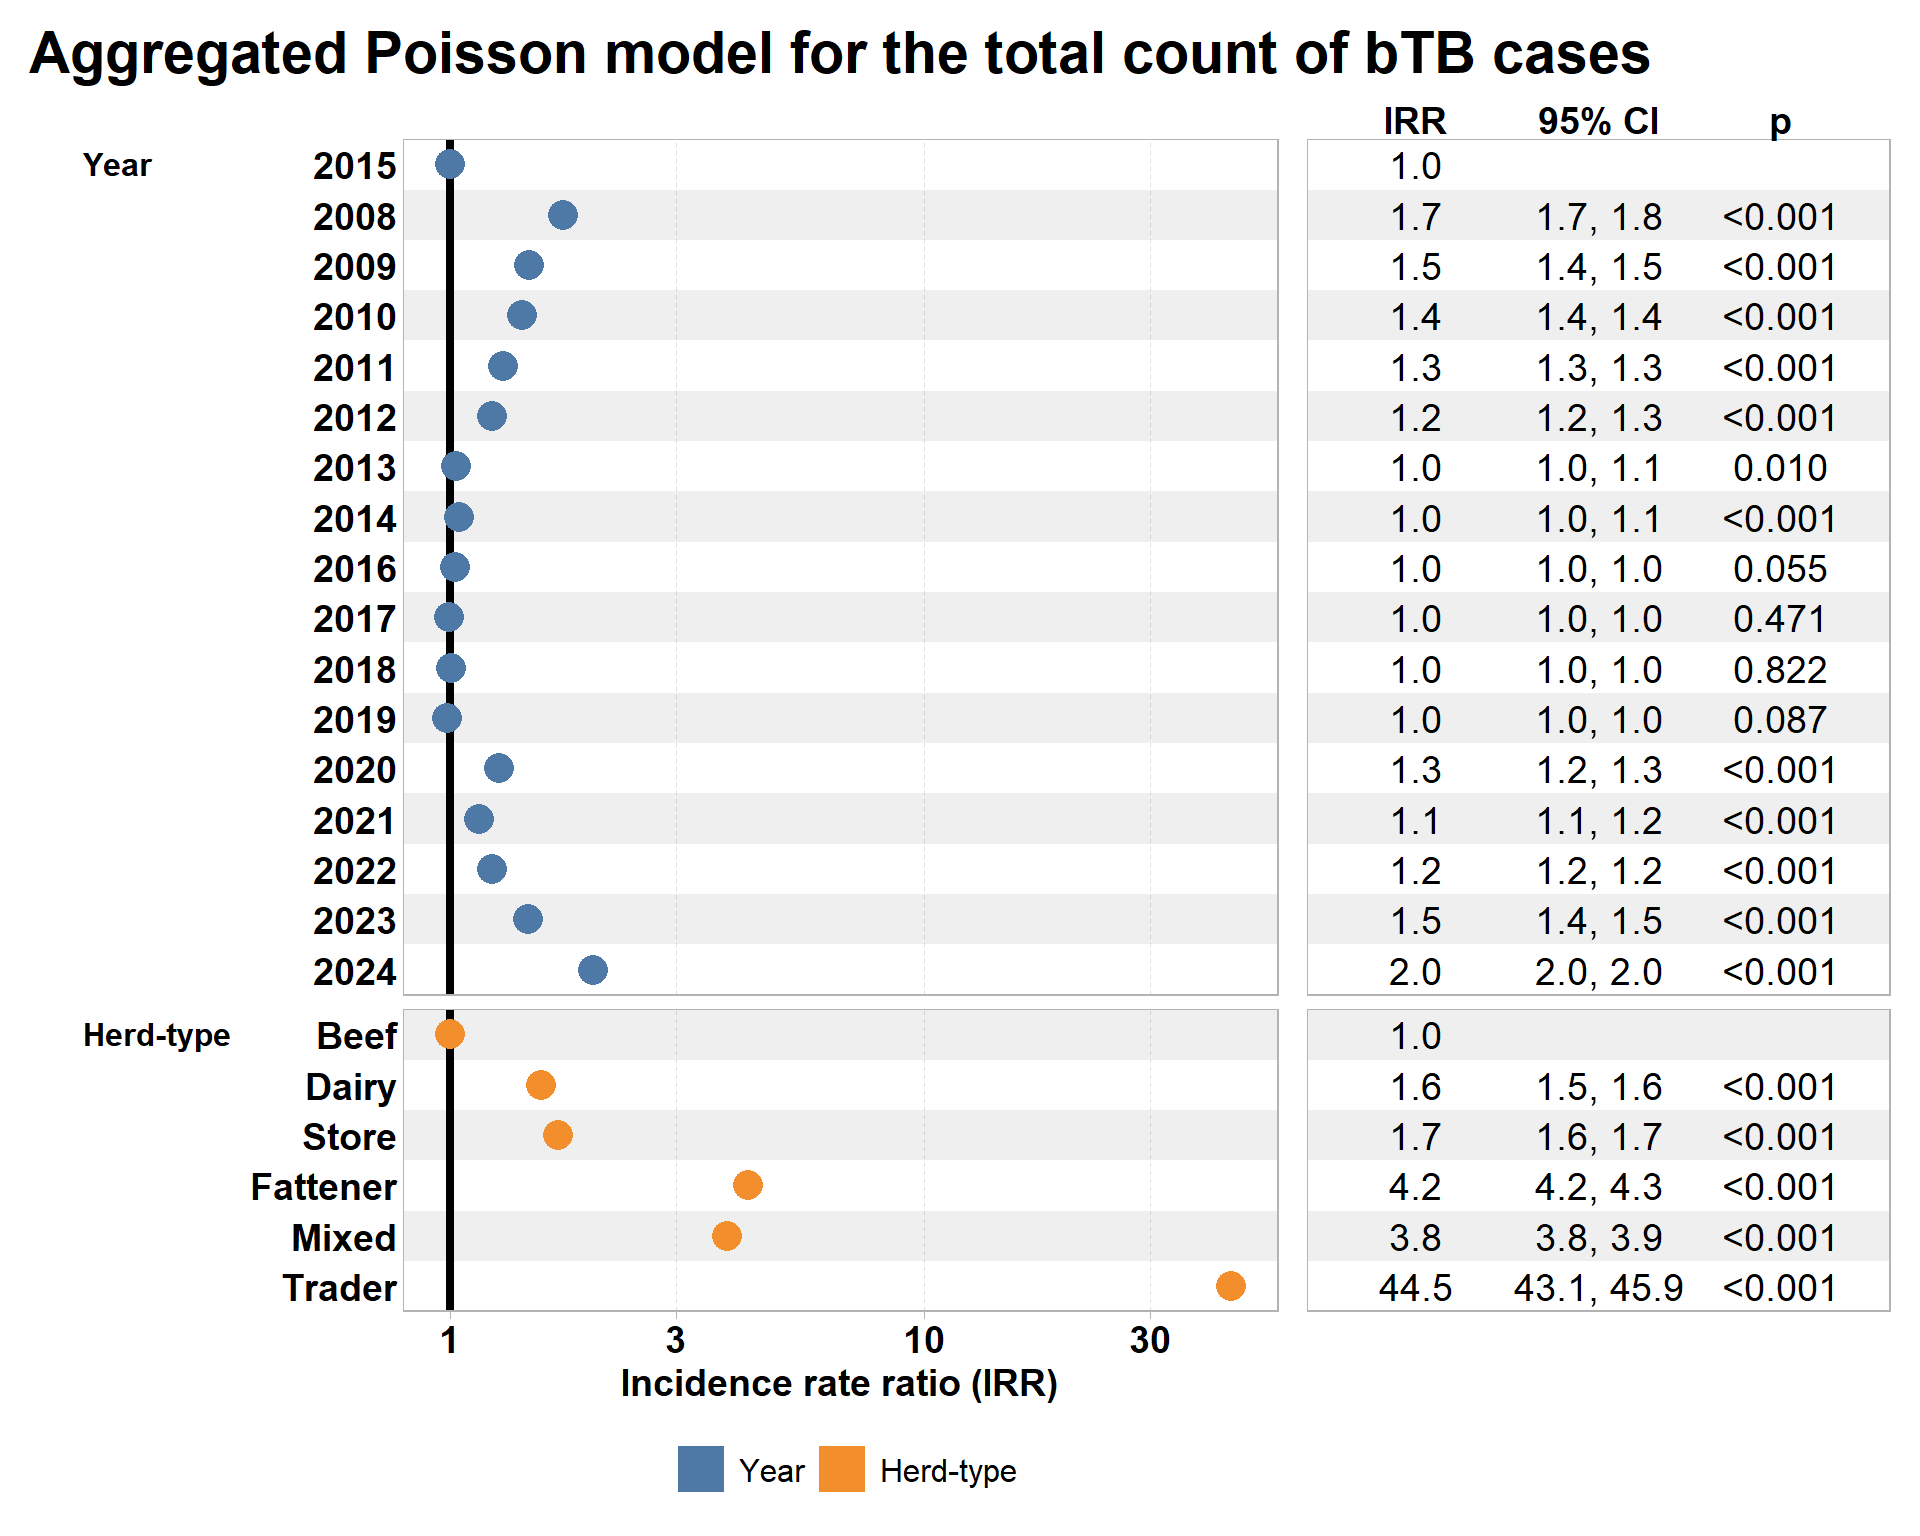
The results are perhaps strange at first (the massive IRR estimate for trader) but I think they make sense. The large effect on trader herds is saying that when you account for testing effort and the population, we see a strong effect of trader herds. Trader herds have a high IRR in the first model but its attentuated when the number of tests are brought in. In essence, its saying that we we see a lot of bTB cases considering the population size and number of tests conducted on trader herds. The per head, per test value is high. Trader herds will not have as many SICTT tests as other herd types (I would imagine a lot of the time if bTB is detected, they send their animals to slaughter so the amount of tests (at animal level) conducted during follow-up will be lower etc).
This is a bit nuance and admittedly strange to have two offsets (but it is permitted in a model).
For now, we am leaving out this combined offset and from here on, we will just include population as the offset which is a more standard approach.
11.2 Model without trader herds
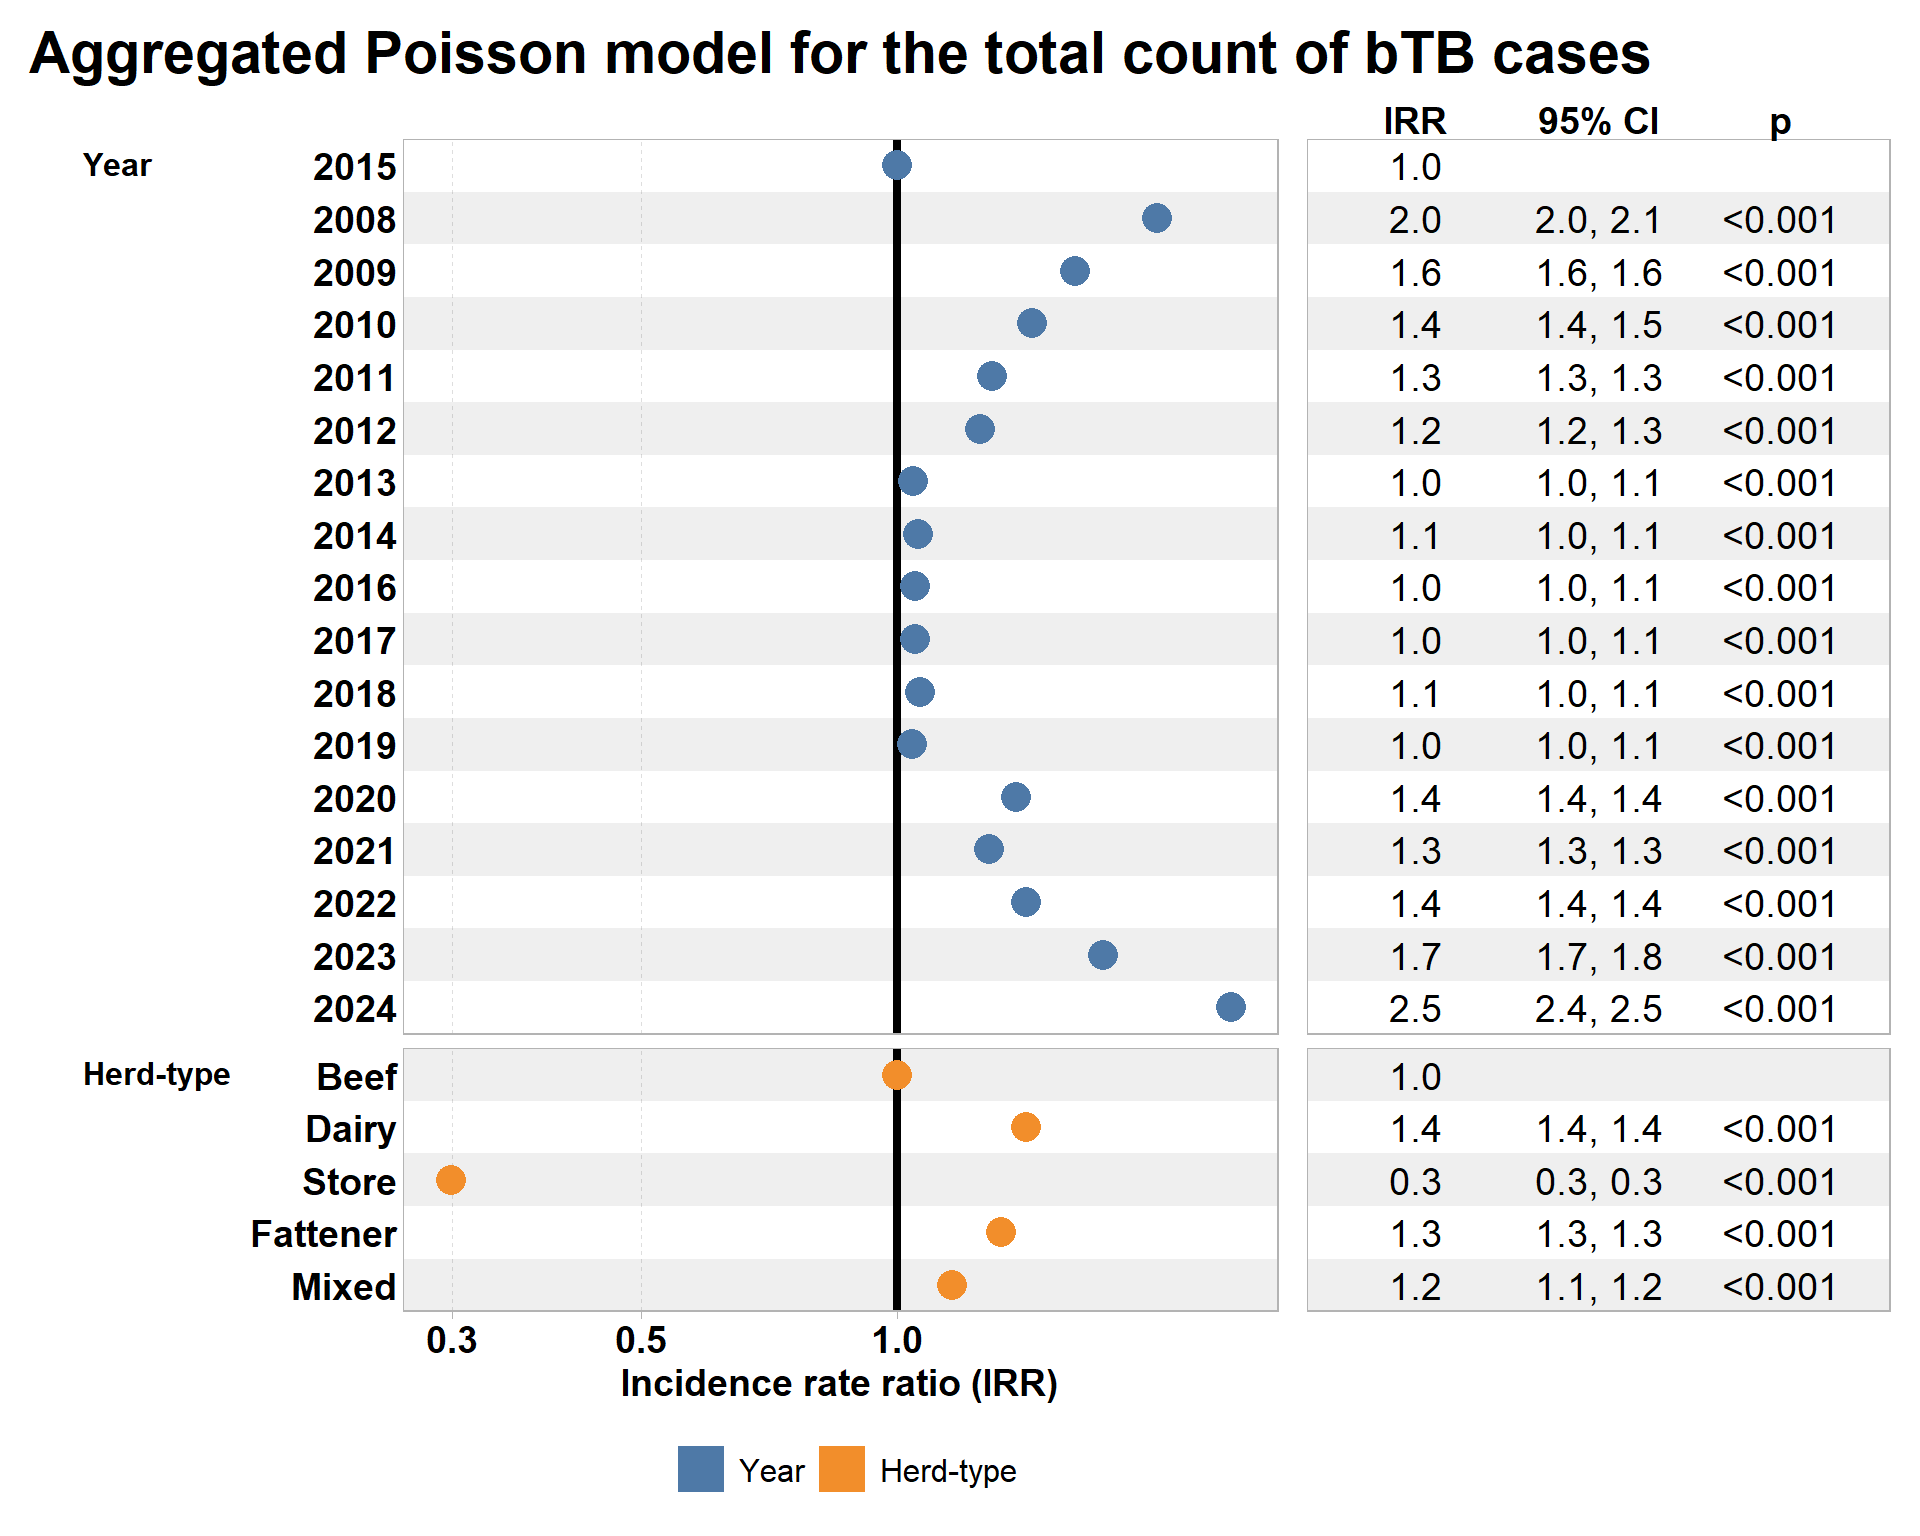
Trader herds are problematic here because we are taking a snapshot of their population (which is changing a lot). We still believe that this approach is ok - the small numbers for the count of cases within traders is not really an issue, we see similar numbers in store herds. Repeating this by month would be a really useful exercise and one we should (we dont have a count of animals in every herd for the 1st of each month, just 1st Jan/May/Sept. It would involve a bit of work to estimate these but something we want to do at some stage). We would end up with very few cases in some months though.
So with that in mind, we have repeated the model without trader herds:
11.2.1 Dispersion test
# Overdispersion test

       dispersion ratio =  114.772
  Pearson's Chi-Squared = 7345.429
                p-value =  < 0.001
Over dispersion present, repeat using negative binomial.
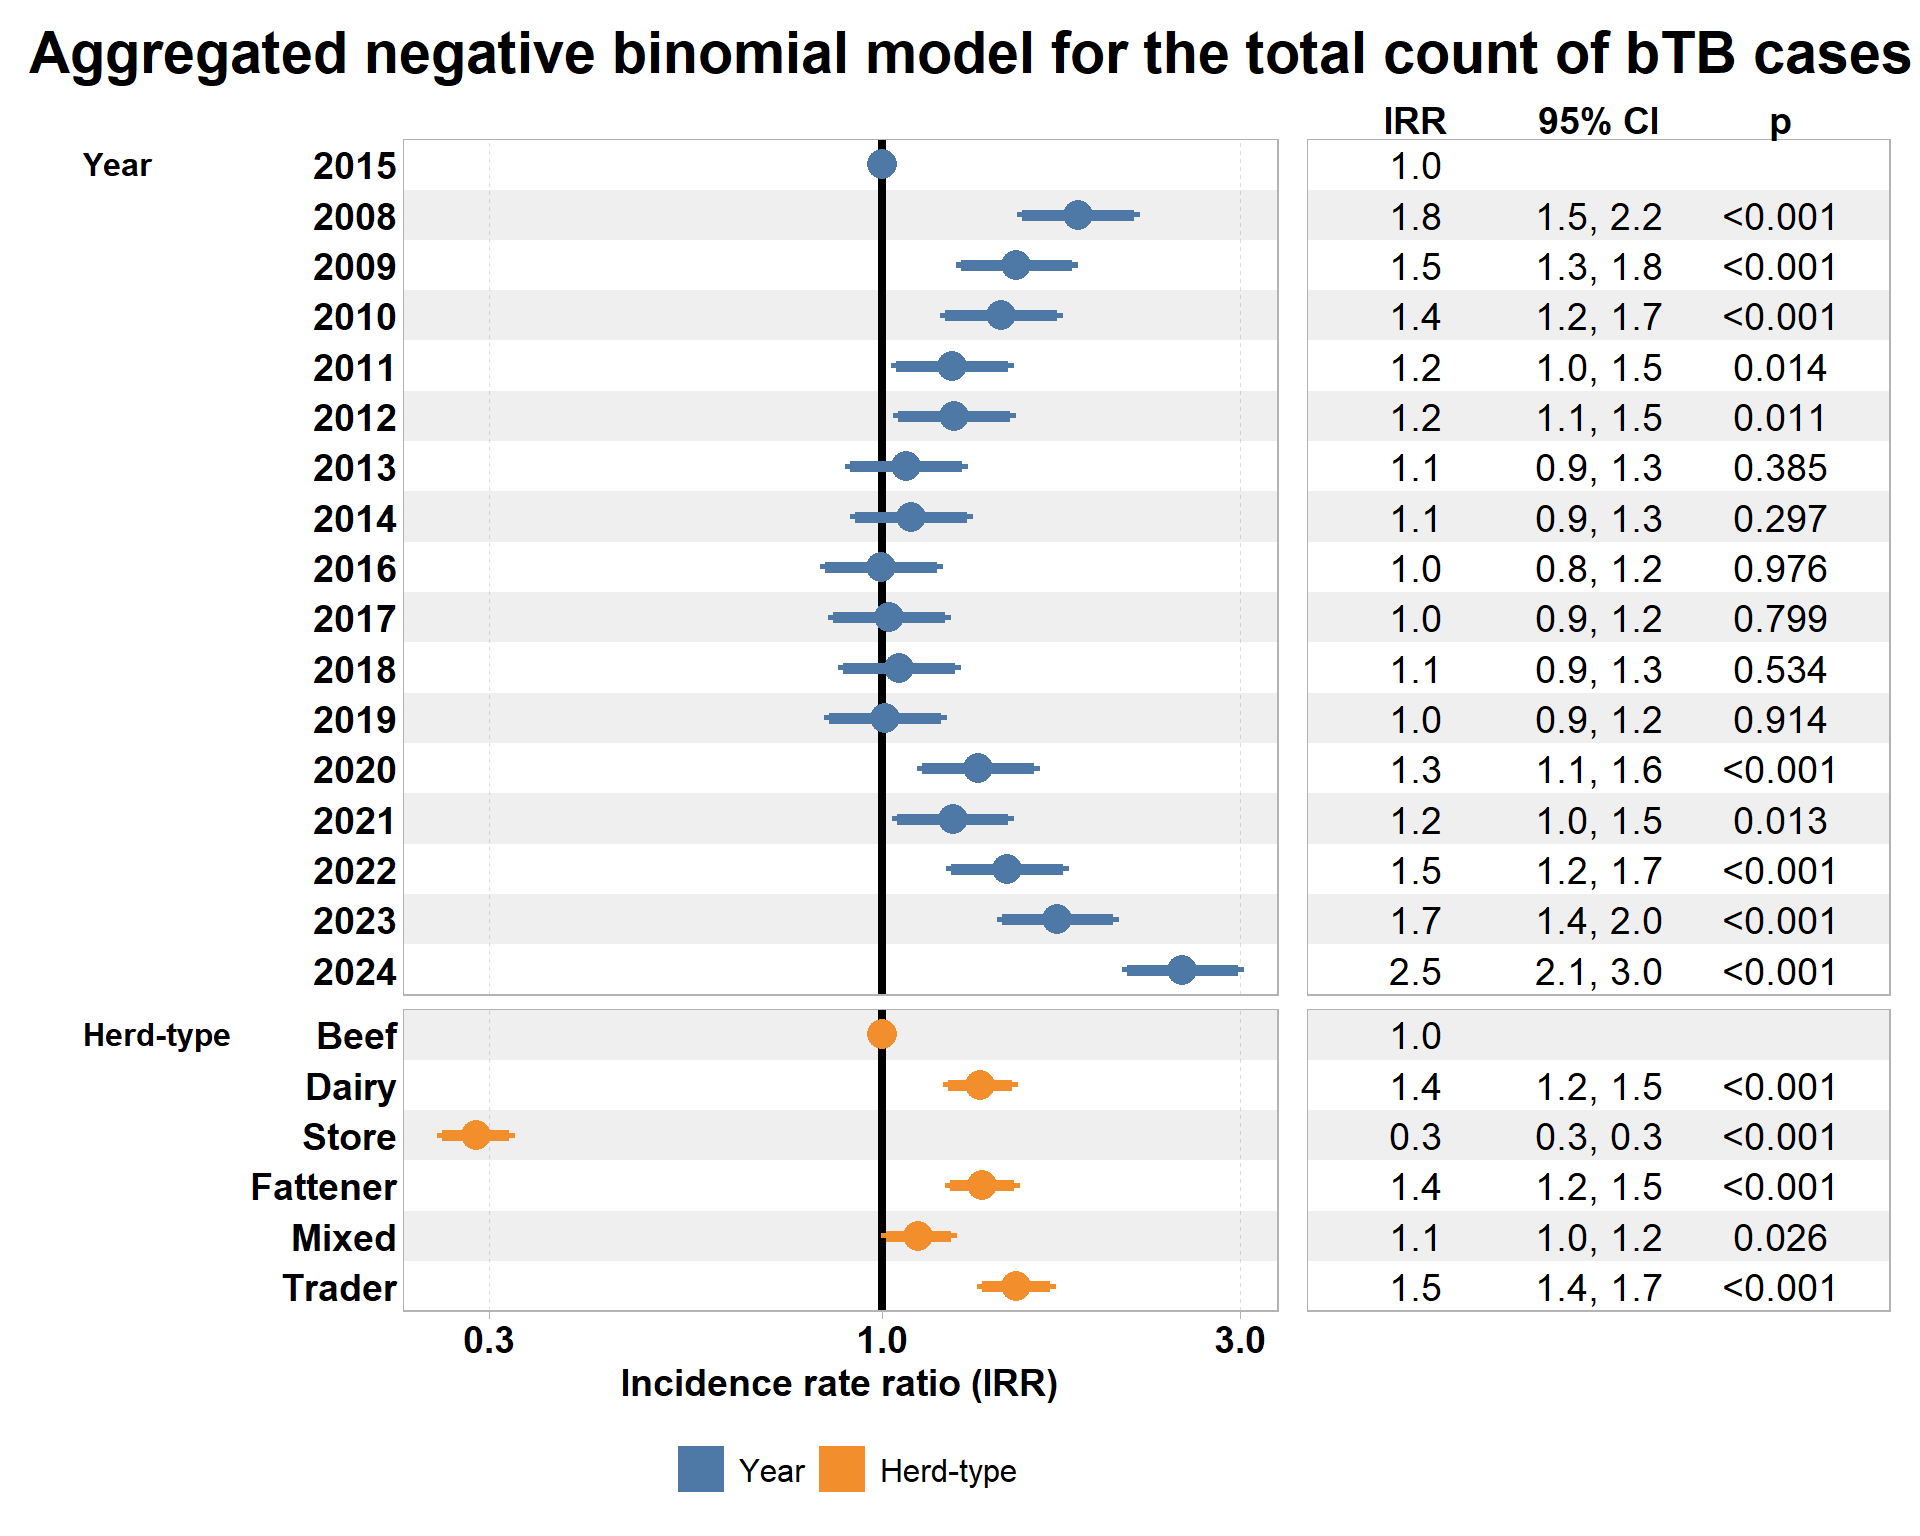
12 Negative binomial models
12.1 All herds
12.2 Trader herds removed
12.3 Estimated rates (per 1000)
Here, I’ve estimated marginal means and plots of these.
 herd_type_ml_description year response     SE  df asymp.LCL asymp.UCL
 Beef                     2015    2.231 0.1560 Inf     1.945     2.560
 Dairy                    2015    3.028 0.2120 Inf     2.639     3.474
 Store                    2015    0.643 0.0459 Inf     0.559     0.740
 Fattener                 2015    3.033 0.2130 Inf     2.643     3.481
 Mixed                    2015    2.502 0.1760 Inf     2.180     2.872
 Beef                     2008    4.315 0.3010 Inf     3.763     4.948
 Dairy                    2008    5.855 0.4090 Inf     5.106     6.714
 Store                    2008    1.244 0.0883 Inf     1.083     1.430
 Fattener                 2008    5.866 0.4100 Inf     5.115     6.727
 Mixed                    2008    4.839 0.3380 Inf     4.219     5.550
 Beef                     2009    3.473 0.2430 Inf     3.028     3.983
 Dairy                    2009    4.712 0.3300 Inf     4.108     5.405
 Store                    2009    1.001 0.0712 Inf     0.871     1.151
 Fattener                 2009    4.721 0.3310 Inf     4.116     5.416
 Mixed                    2009    3.895 0.2730 Inf     3.395     4.468
 Beef                     2010    3.227 0.2260 Inf     2.813     3.702
 Dairy                    2010    4.379 0.3070 Inf     3.817     5.024
 Store                    2010    0.930 0.0664 Inf     0.809     1.070
 Fattener                 2010    4.387 0.3080 Inf     3.823     5.034
 Mixed                    2010    3.619 0.2540 Inf     3.154     4.153
 Beef                     2011    2.691 0.1890 Inf     2.345     3.089
 Dairy                    2011    3.652 0.2560 Inf     3.182     4.191
 Store                    2011    0.776 0.0555 Inf     0.675     0.893
 Fattener                 2011    3.659 0.2570 Inf     3.188     4.200
 Mixed                    2011    3.018 0.2120 Inf     2.629     3.465
 Beef                     2012    2.694 0.1890 Inf     2.348     3.090
 Dairy                    2012    3.655 0.2560 Inf     3.186     4.193
 Store                    2012    0.777 0.0553 Inf     0.676     0.893
 Fattener                 2012    3.662 0.2570 Inf     3.192     4.202
 Mixed                    2012    3.021 0.2120 Inf     2.633     3.467
 Beef                     2013    2.374 0.1670 Inf     2.069     2.725
 Dairy                    2013    3.222 0.2260 Inf     2.808     3.697
 Store                    2013    0.685 0.0489 Inf     0.595     0.787
 Fattener                 2013    3.228 0.2270 Inf     2.812     3.705
 Mixed                    2013    2.663 0.1870 Inf     2.320     3.056
 Beef                     2014    2.399 0.1680 Inf     2.091     2.753
 Dairy                    2014    3.256 0.2280 Inf     2.837     3.735
 Store                    2014    0.692 0.0494 Inf     0.602     0.796
 Fattener                 2014    3.262 0.2290 Inf     2.842     3.743
 Mixed                    2014    2.691 0.1890 Inf     2.344     3.088
 Beef                     2016    2.189 0.1530 Inf     1.908     2.512
 Dairy                    2016    2.970 0.2080 Inf     2.589     3.408
 Store                    2016    0.631 0.0450 Inf     0.549     0.726
 Fattener                 2016    2.976 0.2090 Inf     2.594     3.415
 Mixed                    2016    2.455 0.1720 Inf     2.139     2.817
 Beef                     2017    2.243 0.1570 Inf     1.956     2.573
 Dairy                    2017    3.044 0.2130 Inf     2.654     3.492
 Store                    2017    0.647 0.0460 Inf     0.563     0.744
 Fattener                 2017    3.050 0.2140 Inf     2.658     3.499
 Mixed                    2017    2.516 0.1770 Inf     2.193     2.887
 Beef                     2018    2.366 0.1660 Inf     2.062     2.714
 Dairy                    2018    3.210 0.2250 Inf     2.799     3.682
 Store                    2018    0.682 0.0485 Inf     0.593     0.784
 Fattener                 2018    3.216 0.2250 Inf     2.803     3.689
 Mixed                    2018    2.653 0.1860 Inf     2.312     3.044
 Beef                     2019    2.275 0.1590 Inf     1.983     2.610
 Dairy                    2019    3.087 0.2160 Inf     2.691     3.541
 Store                    2019    0.656 0.0467 Inf     0.571     0.754
 Fattener                 2019    3.093 0.2170 Inf     2.696     3.548
 Mixed                    2019    2.552 0.1790 Inf     2.224     2.928
 Beef                     2020    3.004 0.2100 Inf     2.620     3.444
 Dairy                    2020    4.076 0.2840 Inf     3.555     4.673
 Store                    2020    0.866 0.0613 Inf     0.754     0.995
 Fattener                 2020    4.084 0.2850 Inf     3.561     4.683
 Mixed                    2020    3.369 0.2350 Inf     2.938     3.863
 Beef                     2021    2.712 0.1890 Inf     2.365     3.109
 Dairy                    2021    3.680 0.2570 Inf     3.209     4.219
 Store                    2021    0.782 0.0553 Inf     0.681     0.898
 Fattener                 2021    3.687 0.2570 Inf     3.215     4.227
 Mixed                    2021    3.041 0.2130 Inf     2.652     3.488
 Beef                     2022    3.028 0.2110 Inf     2.641     3.471
 Dairy                    2022    4.108 0.2860 Inf     3.584     4.709
 Store                    2022    0.873 0.0617 Inf     0.760     1.003
 Fattener                 2022    4.116 0.2870 Inf     3.590     4.719
 Mixed                    2022    3.395 0.2370 Inf     2.961     3.893
 Beef                     2023    3.575 0.2490 Inf     3.119     4.097
 Dairy                    2023    4.851 0.3370 Inf     4.233     5.559
 Store                    2023    1.031 0.0726 Inf     0.898     1.183
 Fattener                 2023    4.860 0.3380 Inf     4.240     5.571
 Mixed                    2023    4.009 0.2790 Inf     3.498     4.596
 Beef                     2024    5.515 0.3830 Inf     4.813     6.318
 Dairy                    2024    7.483 0.5190 Inf     6.531     8.573
 Store                    2024    1.590 0.1120 Inf     1.386     1.825
 Fattener                 2024    7.497 0.5210 Inf     6.543     8.590
 Mixed                    2024    6.185 0.4300 Inf     5.397     7.087

Confidence level used: 0.95
Intervals are back-transformed from the log scale
12.4 Dispersion test
# Overdispersion test

 dispersion ratio = 1.300
          p-value = 0.224
12.5 Trader population - ADD IN
13 Notes/ideas
- We think the trader results are really interesting and would be of interest for policymakers but we do have to keep in mind the issues with this approach. Worth doing a separate analysis on trader herds specifically, even just highlighting the fact that their prevalence/numbers are going up. The fact that they are going up isnt all that surprising but coupled with the small numbers, its interesting that they are getting “caught” at all. This is primarily driven by slaughter surveillance. So in essence there are probably two cohorts of herds within trader herds. Those that just trade (and so dont send animals to slaughter) and those that do a bit of everything (looking for a quick sale etc).
- in the double offset model, i just looked at count of SICTTs, could expand on that to include count of animals tested at slaughter plant.
- Update from AIM data: From the 2023 movement data, approximately a third of trader sales were to slaughterhouses (32.7 %), 39 % exports, 23% farm to farm, and 5 % via marts.