 bd_first_skin_test_type   n     percent
                       1  55 0.089869281
                     10A  16 0.026143791
                       2   2 0.003267974
                       3   1 0.001633987
                       4  21 0.034313725
                      5A  20 0.032679739
                      5B  14 0.022875817
                      5C   8 0.013071895
                      5E   5 0.008169935
                      5F  69 0.112745098
                      5G   4 0.006535948
                      5H   4 0.006535948
                       6  15 0.024509804
                      7B  17 0.027777778
                       8  12 0.019607843
9A 349 0.5702614387 Exploration of herd-level bTB breakdowns (BDs)
\(~\) \(~\)
7.1 Breakdown (BD) definition
Here, we defined the start date of a BD in a herd as the date when an animal was disclosed as a bTB case, as determined by the SICTT, IFN-γ or by the detection of visible lesions at routine slaughter which are then laboratory confirmed with M. bovis infection (also known as ‘factory lesion cases’). In the situation when a BD started due to the detection of a visible lesion, we chose the start date as the date when the sample was sent to the lab and not the date in which it was identified as culture positive which could be a number of weeks later. Depending on the circumstances, the herds trading_status on AHCS will generally change from free to withdrawn/suspended. We defined the BD end date as the date of the next SICTT (whole herd) test where the trading_status was restored to free. Once a bTB case is detected, a herd will usually remain in a BD until it has had two consecutive, clear whole-herd SICTT tests (usually 60 days apart). There are certain exceptions to the above criteria e.g., singletons.
There were rare instances when a herd was in a BD based on trading status but it did not have a bTB case (these could be for awhole host of reasons including fraud investigations (so a herd may be in suspended mode although no cases), error on system etc.). Of all BDs after 2007 (n = 87761), there were only 612 of these zero case BDs (0.7%). The initiating/index SICTT of these BDs is given below:
\(~\) \(~\)
\(~\) \(~\)
For the purposes of this work, we have excluded these cases along with extremely short BD (<60 days in length):
# DROP short and zero cases ----
bd_df <- bd_df %>%
  filter(all_cases != 0) %>%
  filter(bd_duration_days >= 60)
\(~\) \(~\)
\(~\) \(~\)
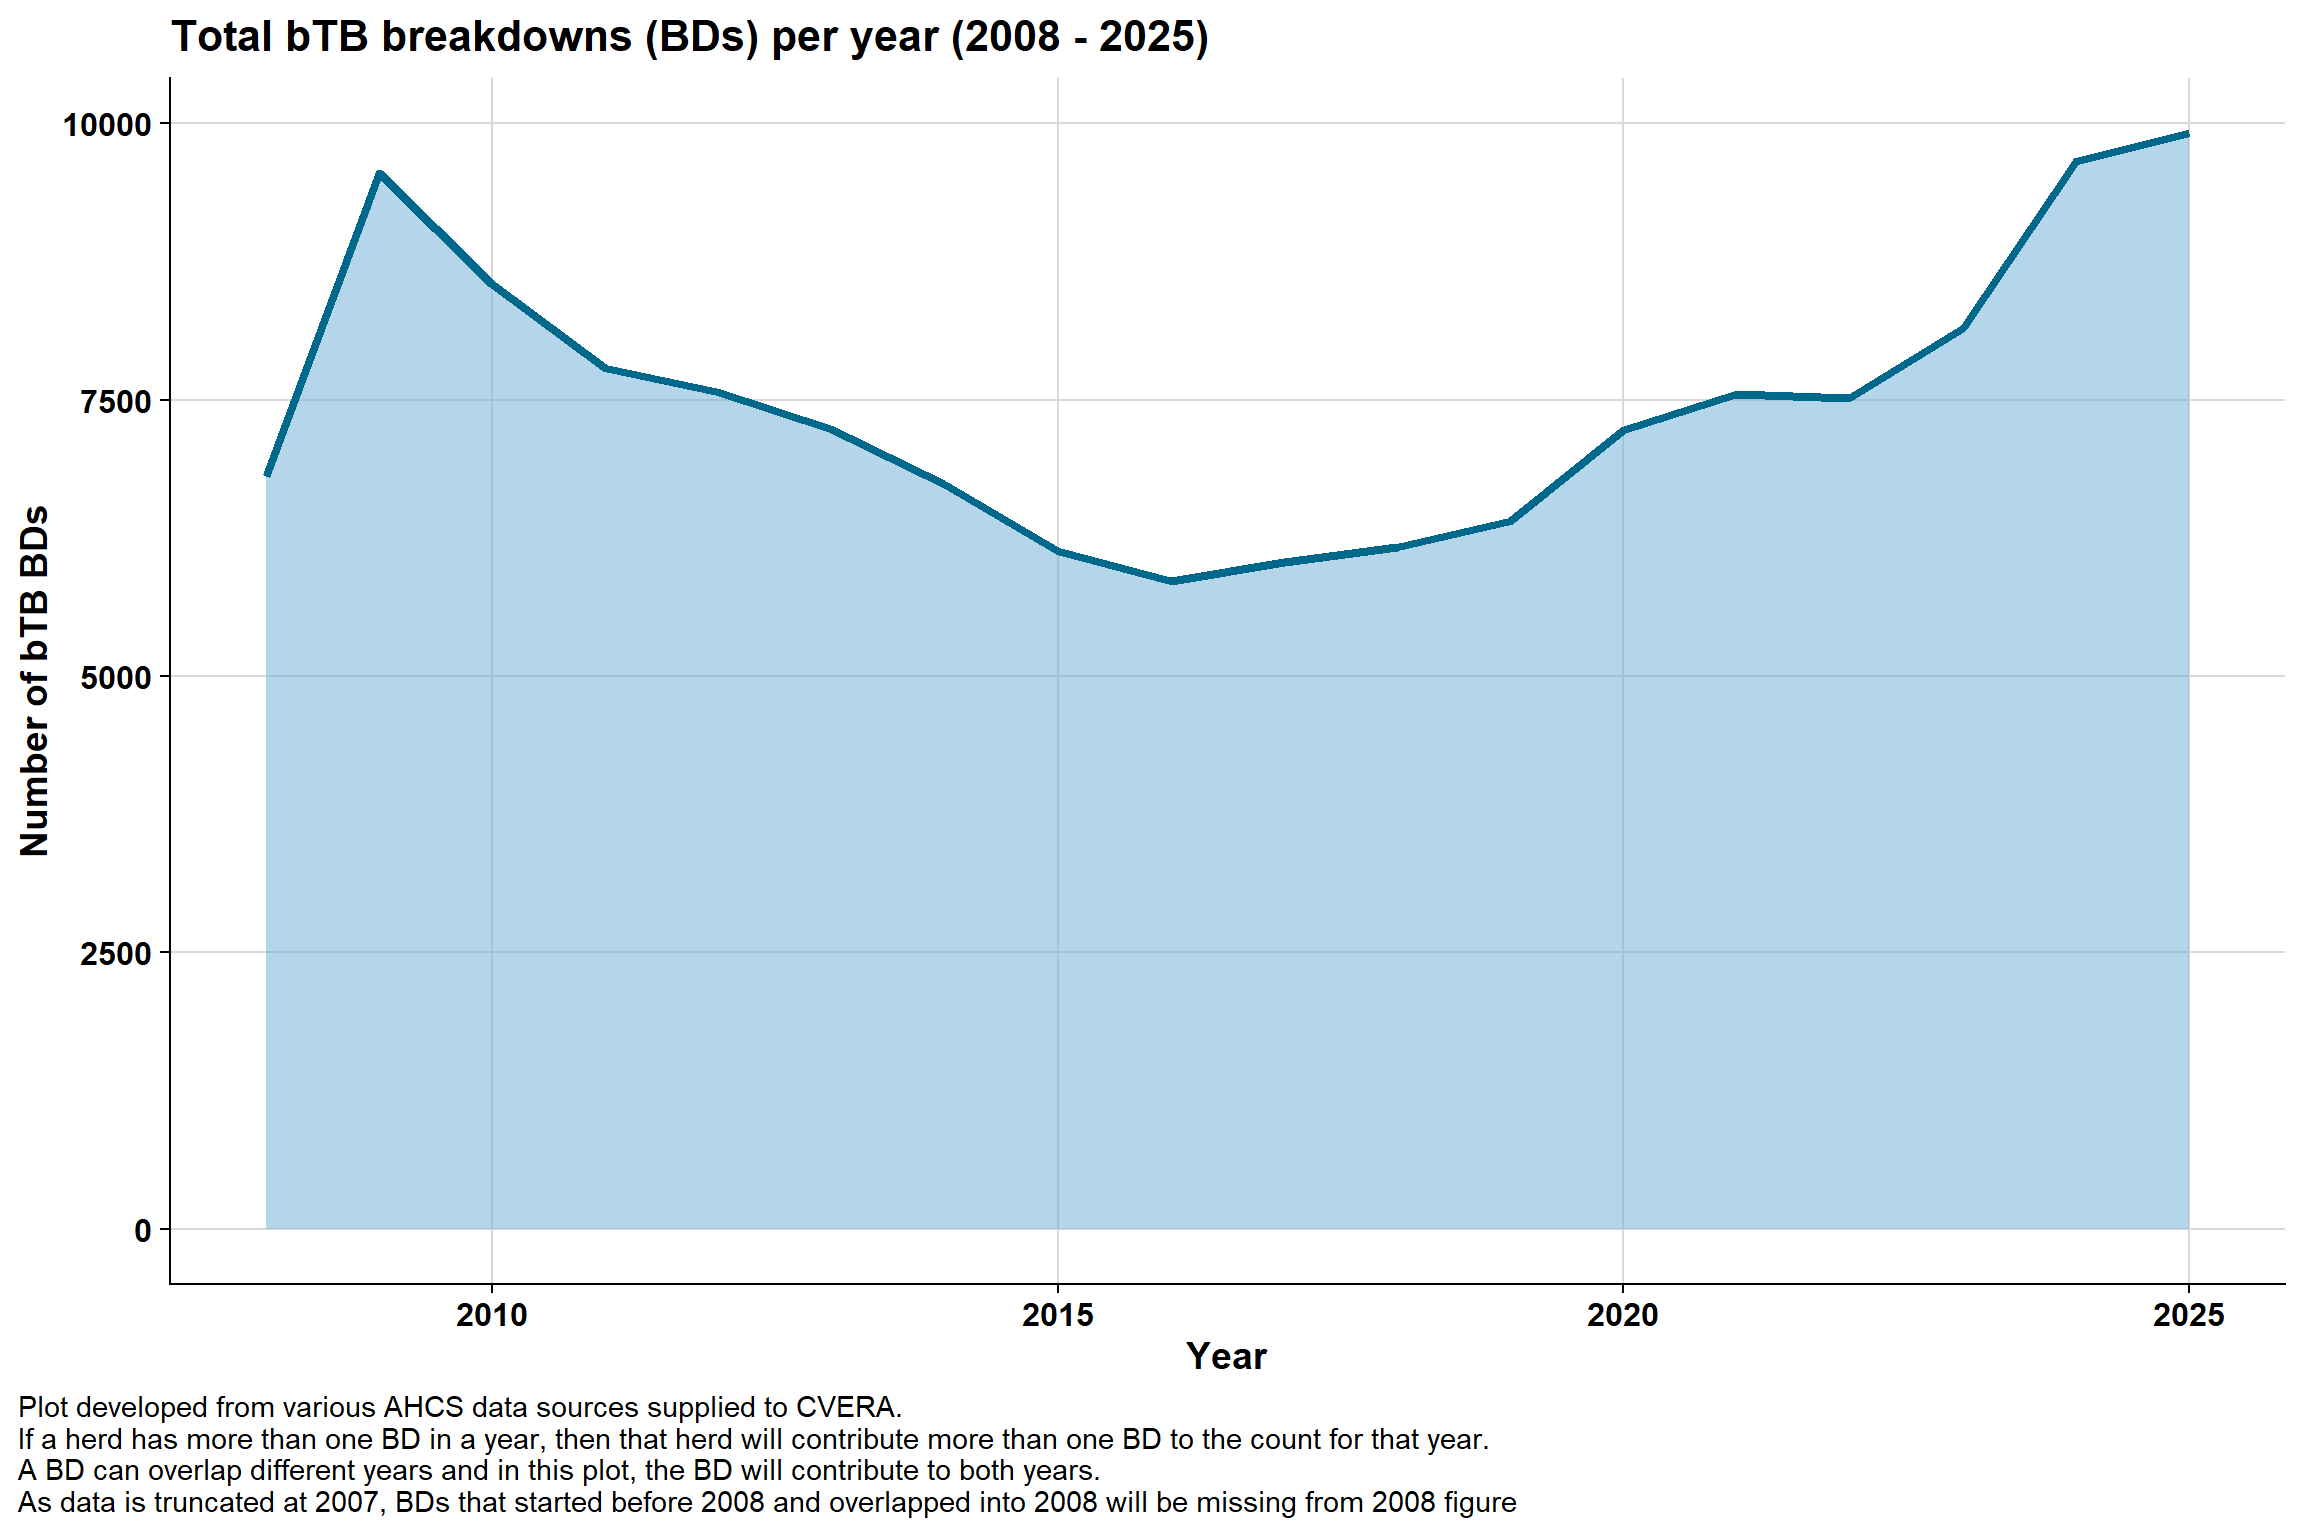
7.2 Number of BDs over time
7.2.1 Per year
\(~\) \(~\)
\(~\) \(~\)
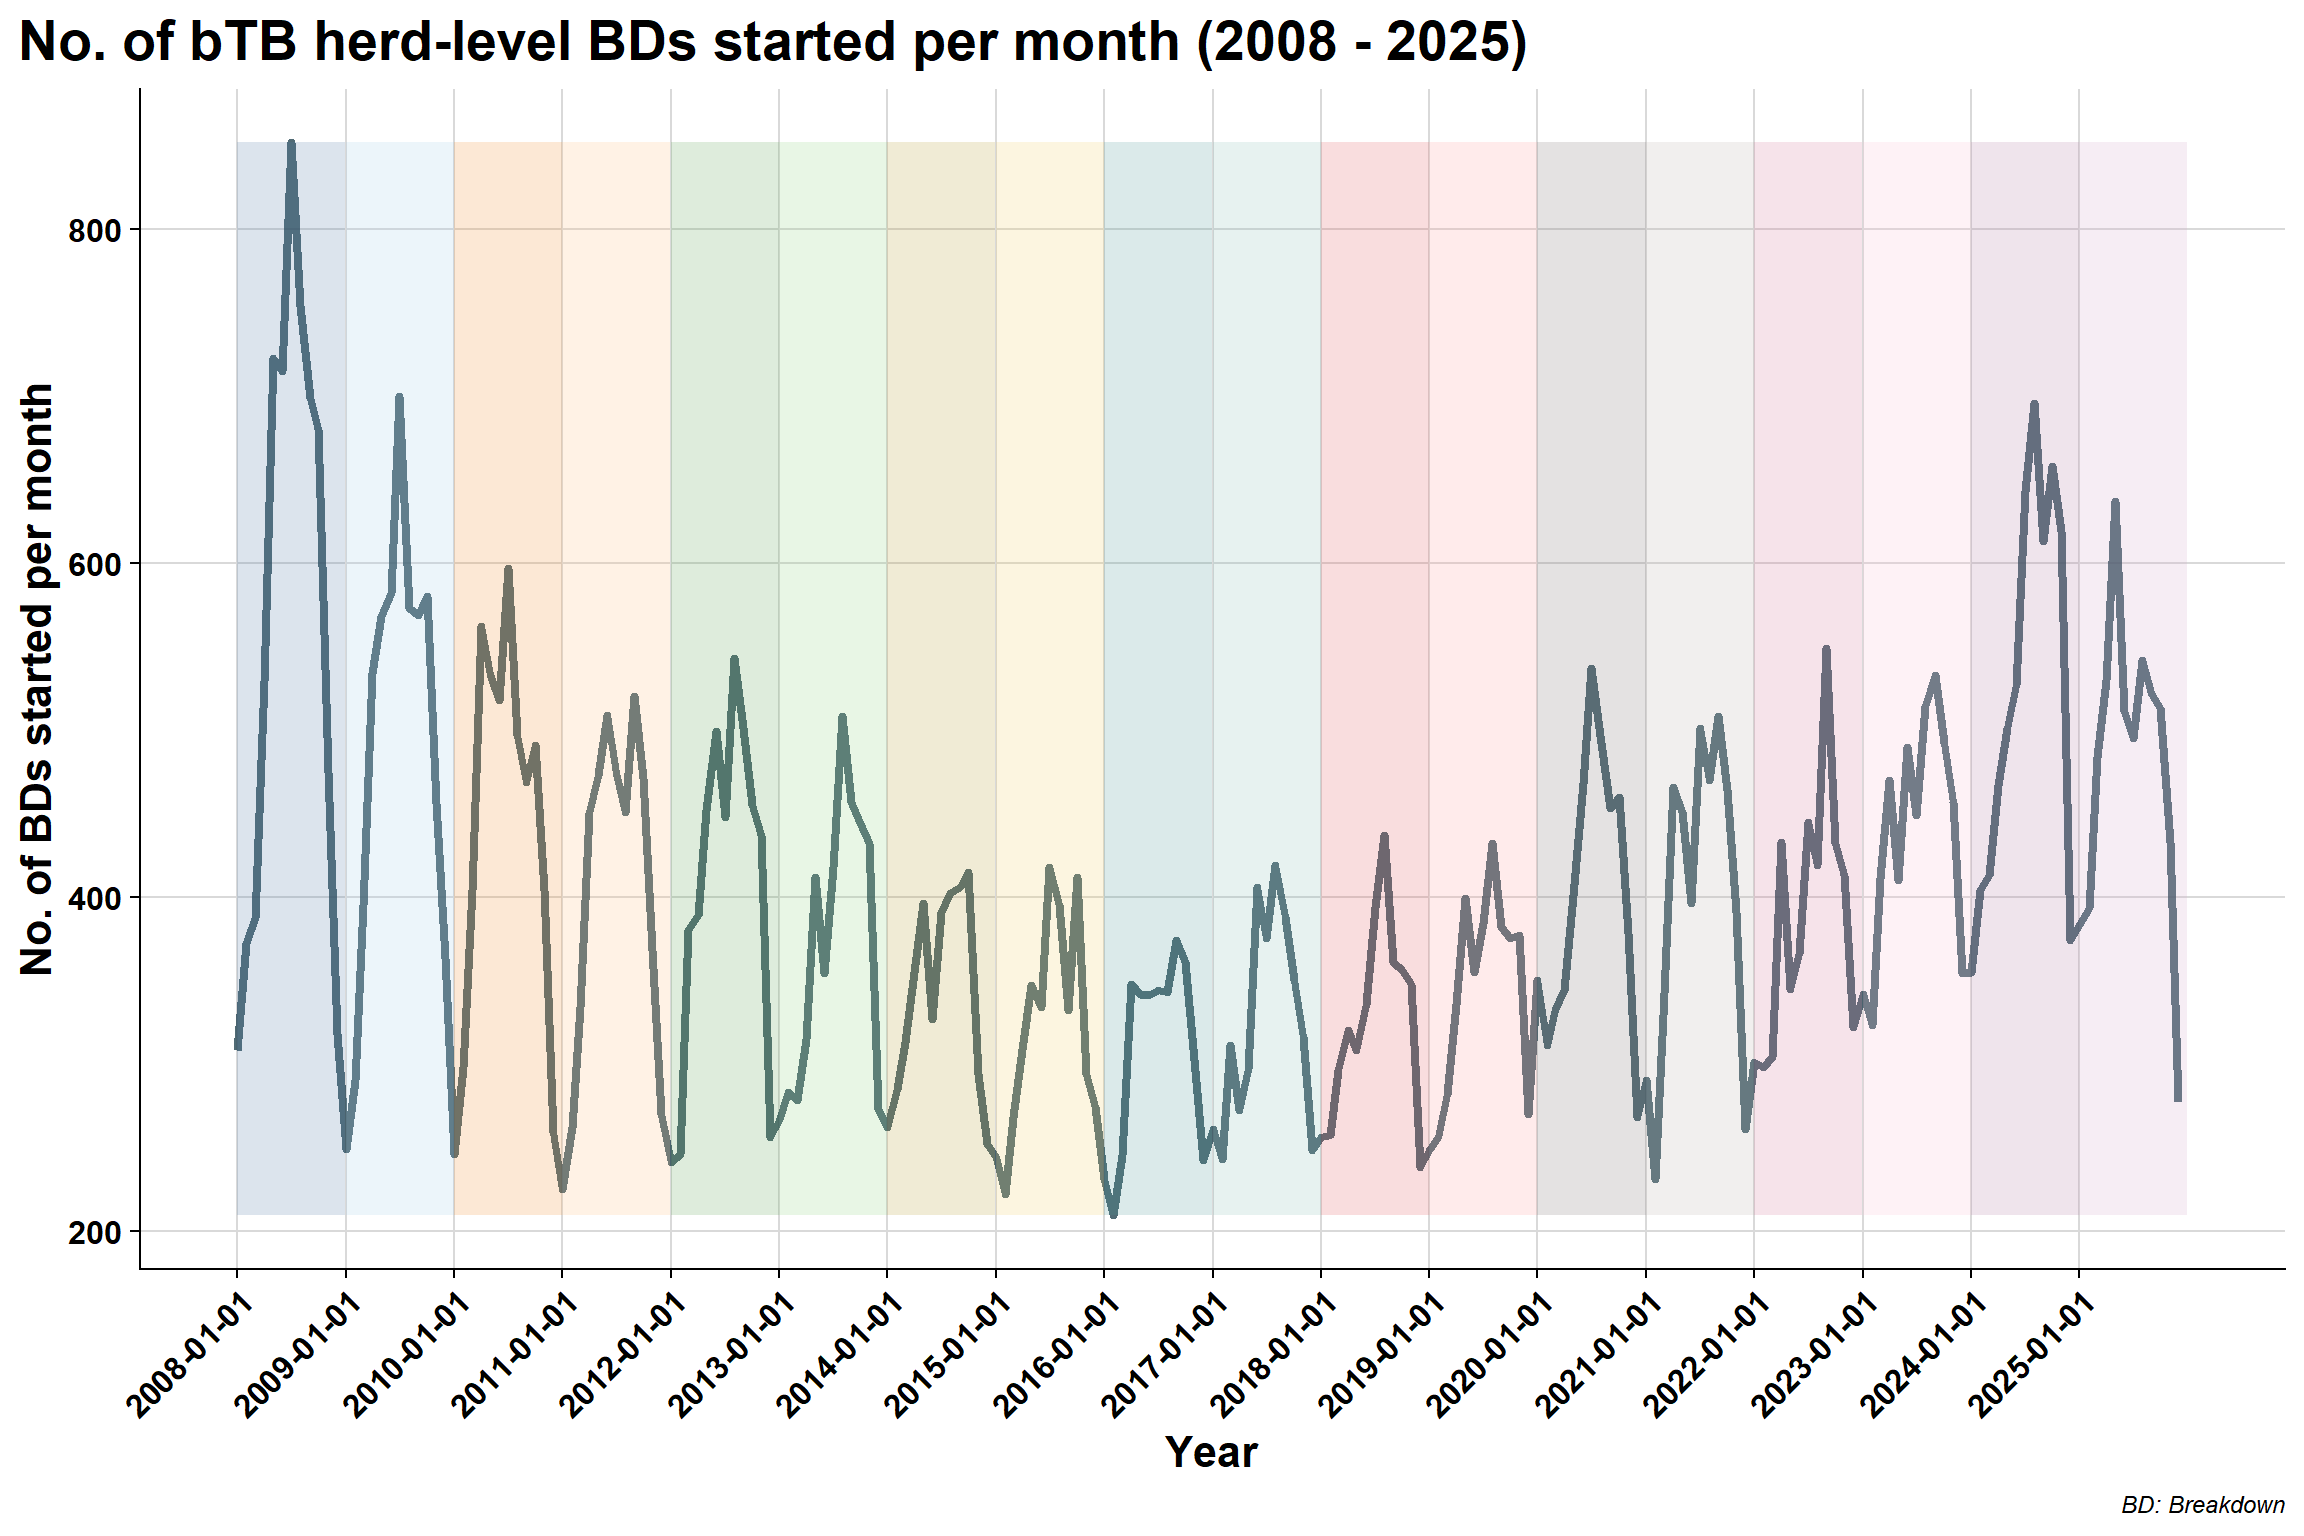
7.2.2 Per month
\(~\) \(~\)
\(~\) \(~\)
7.2.3 Per month and by herd-type
\(~\) \(~\)
\(~\) \(~\)
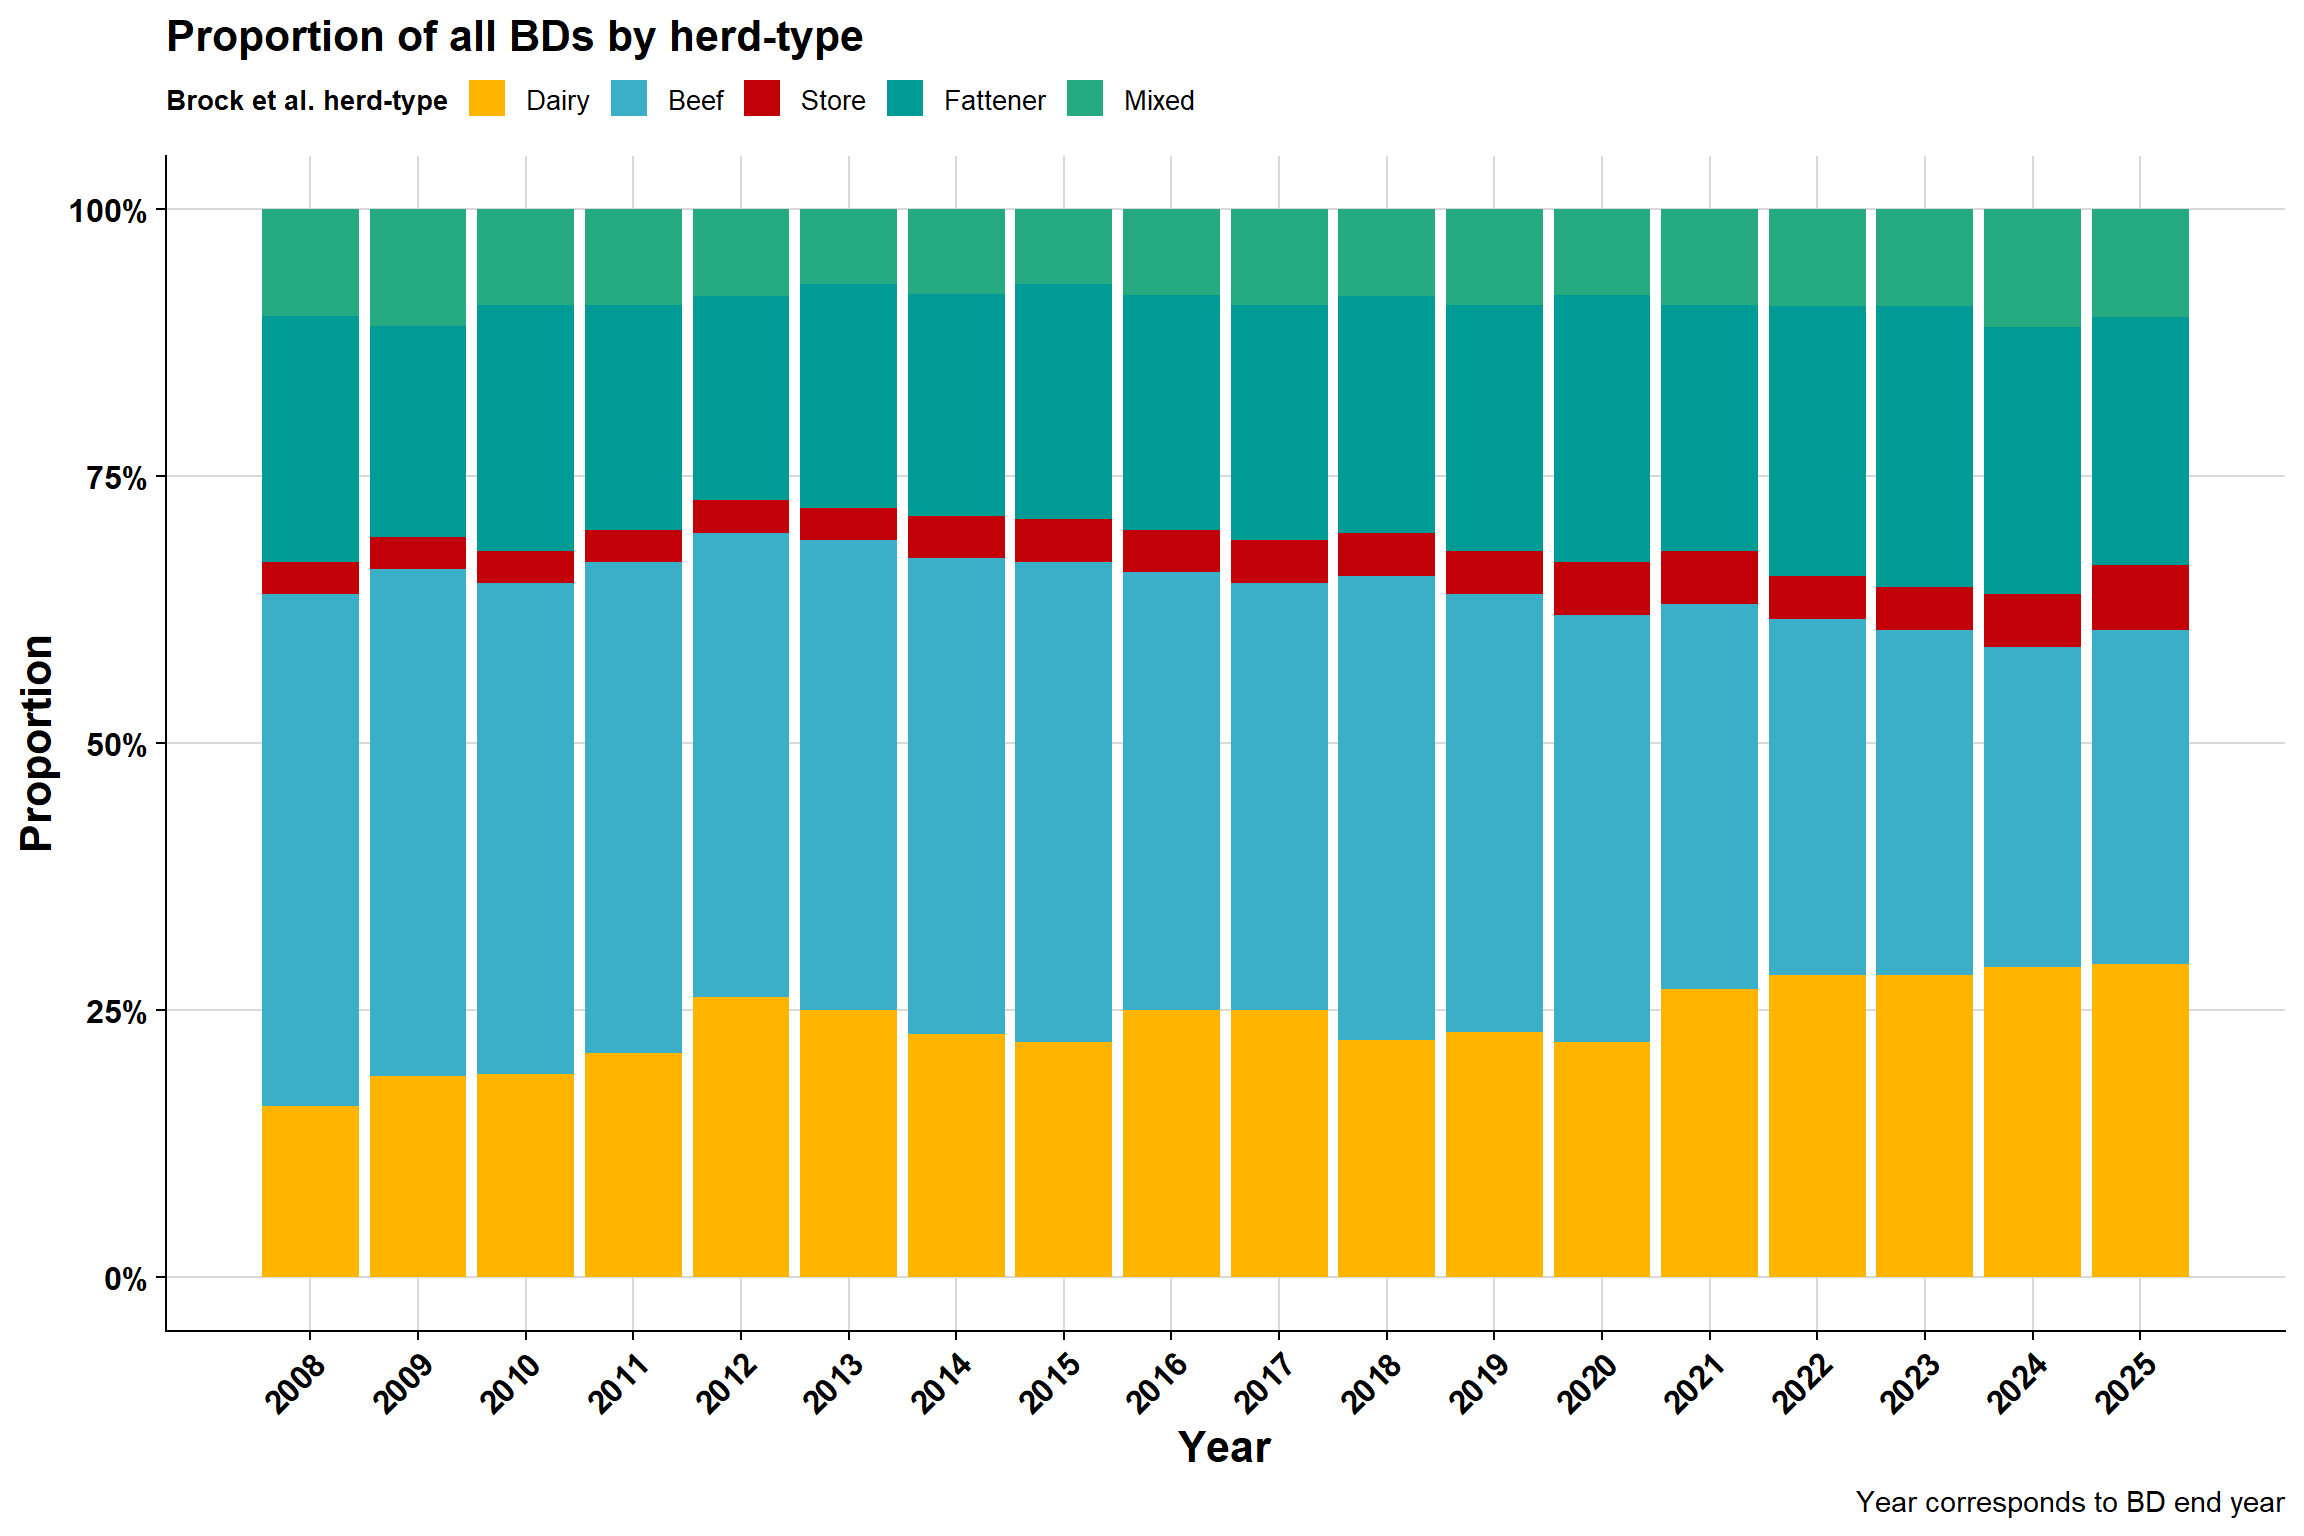
7.3 BD by herd-type
\(~\) \(~\)
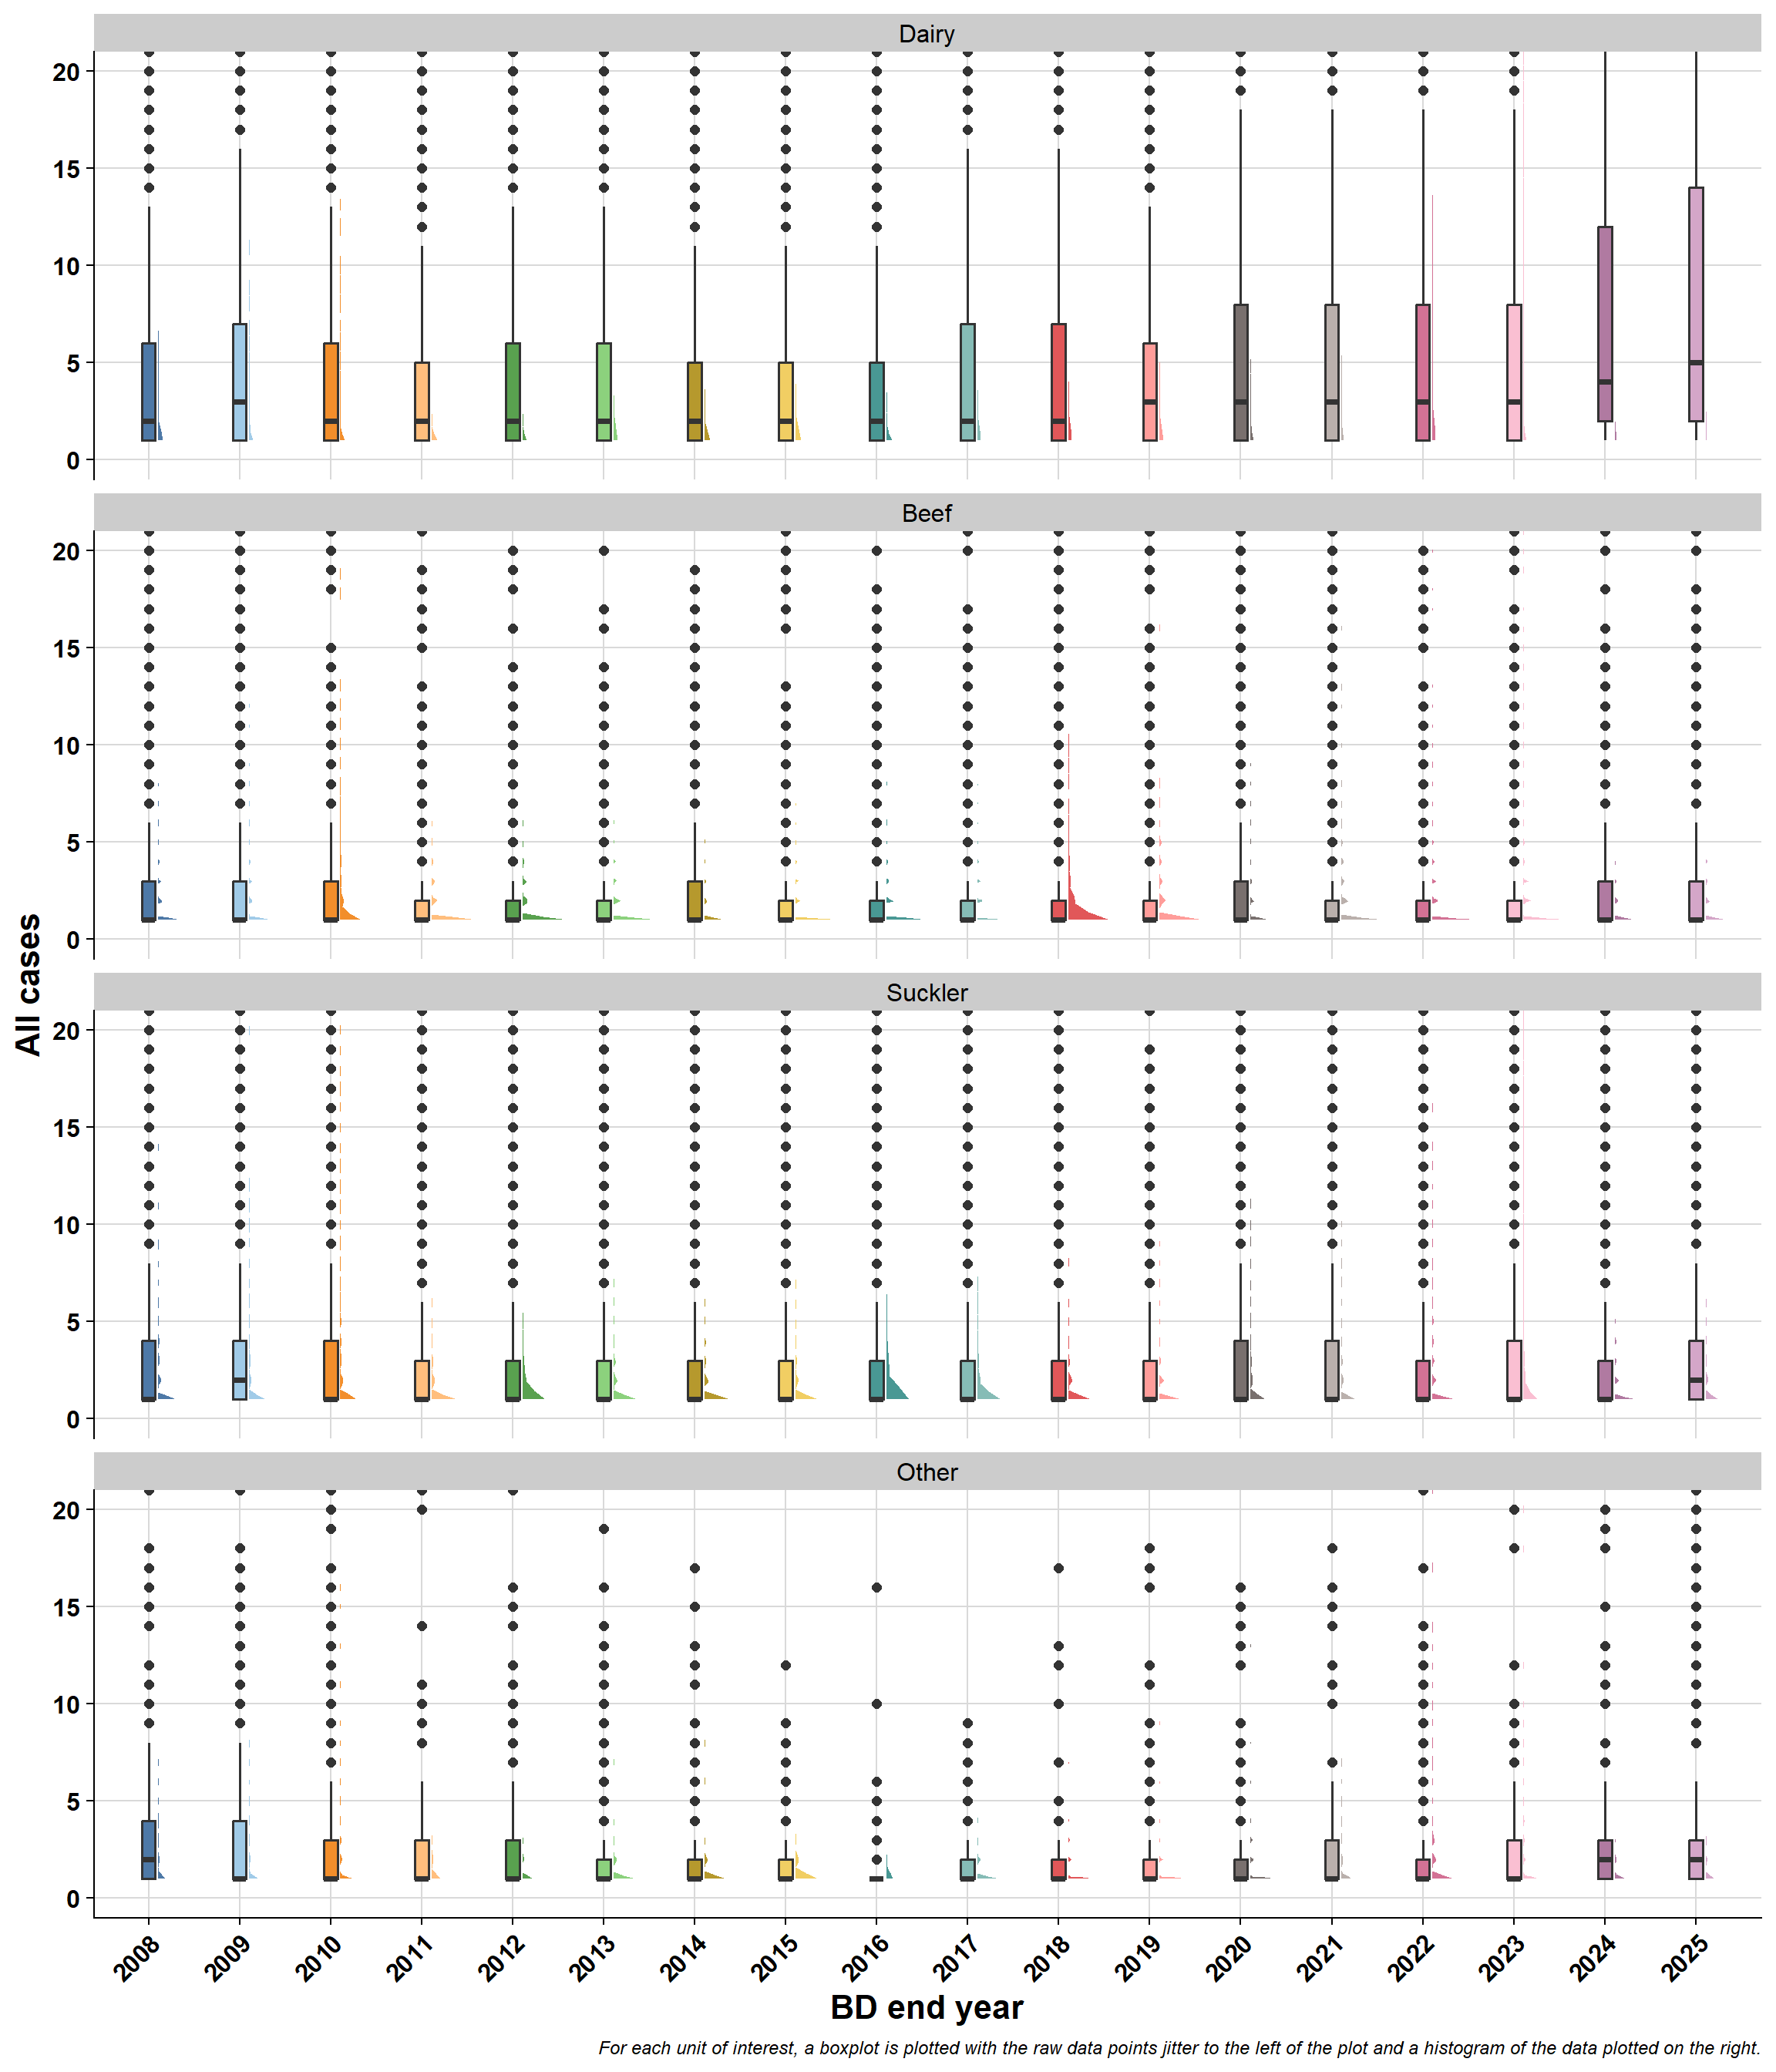
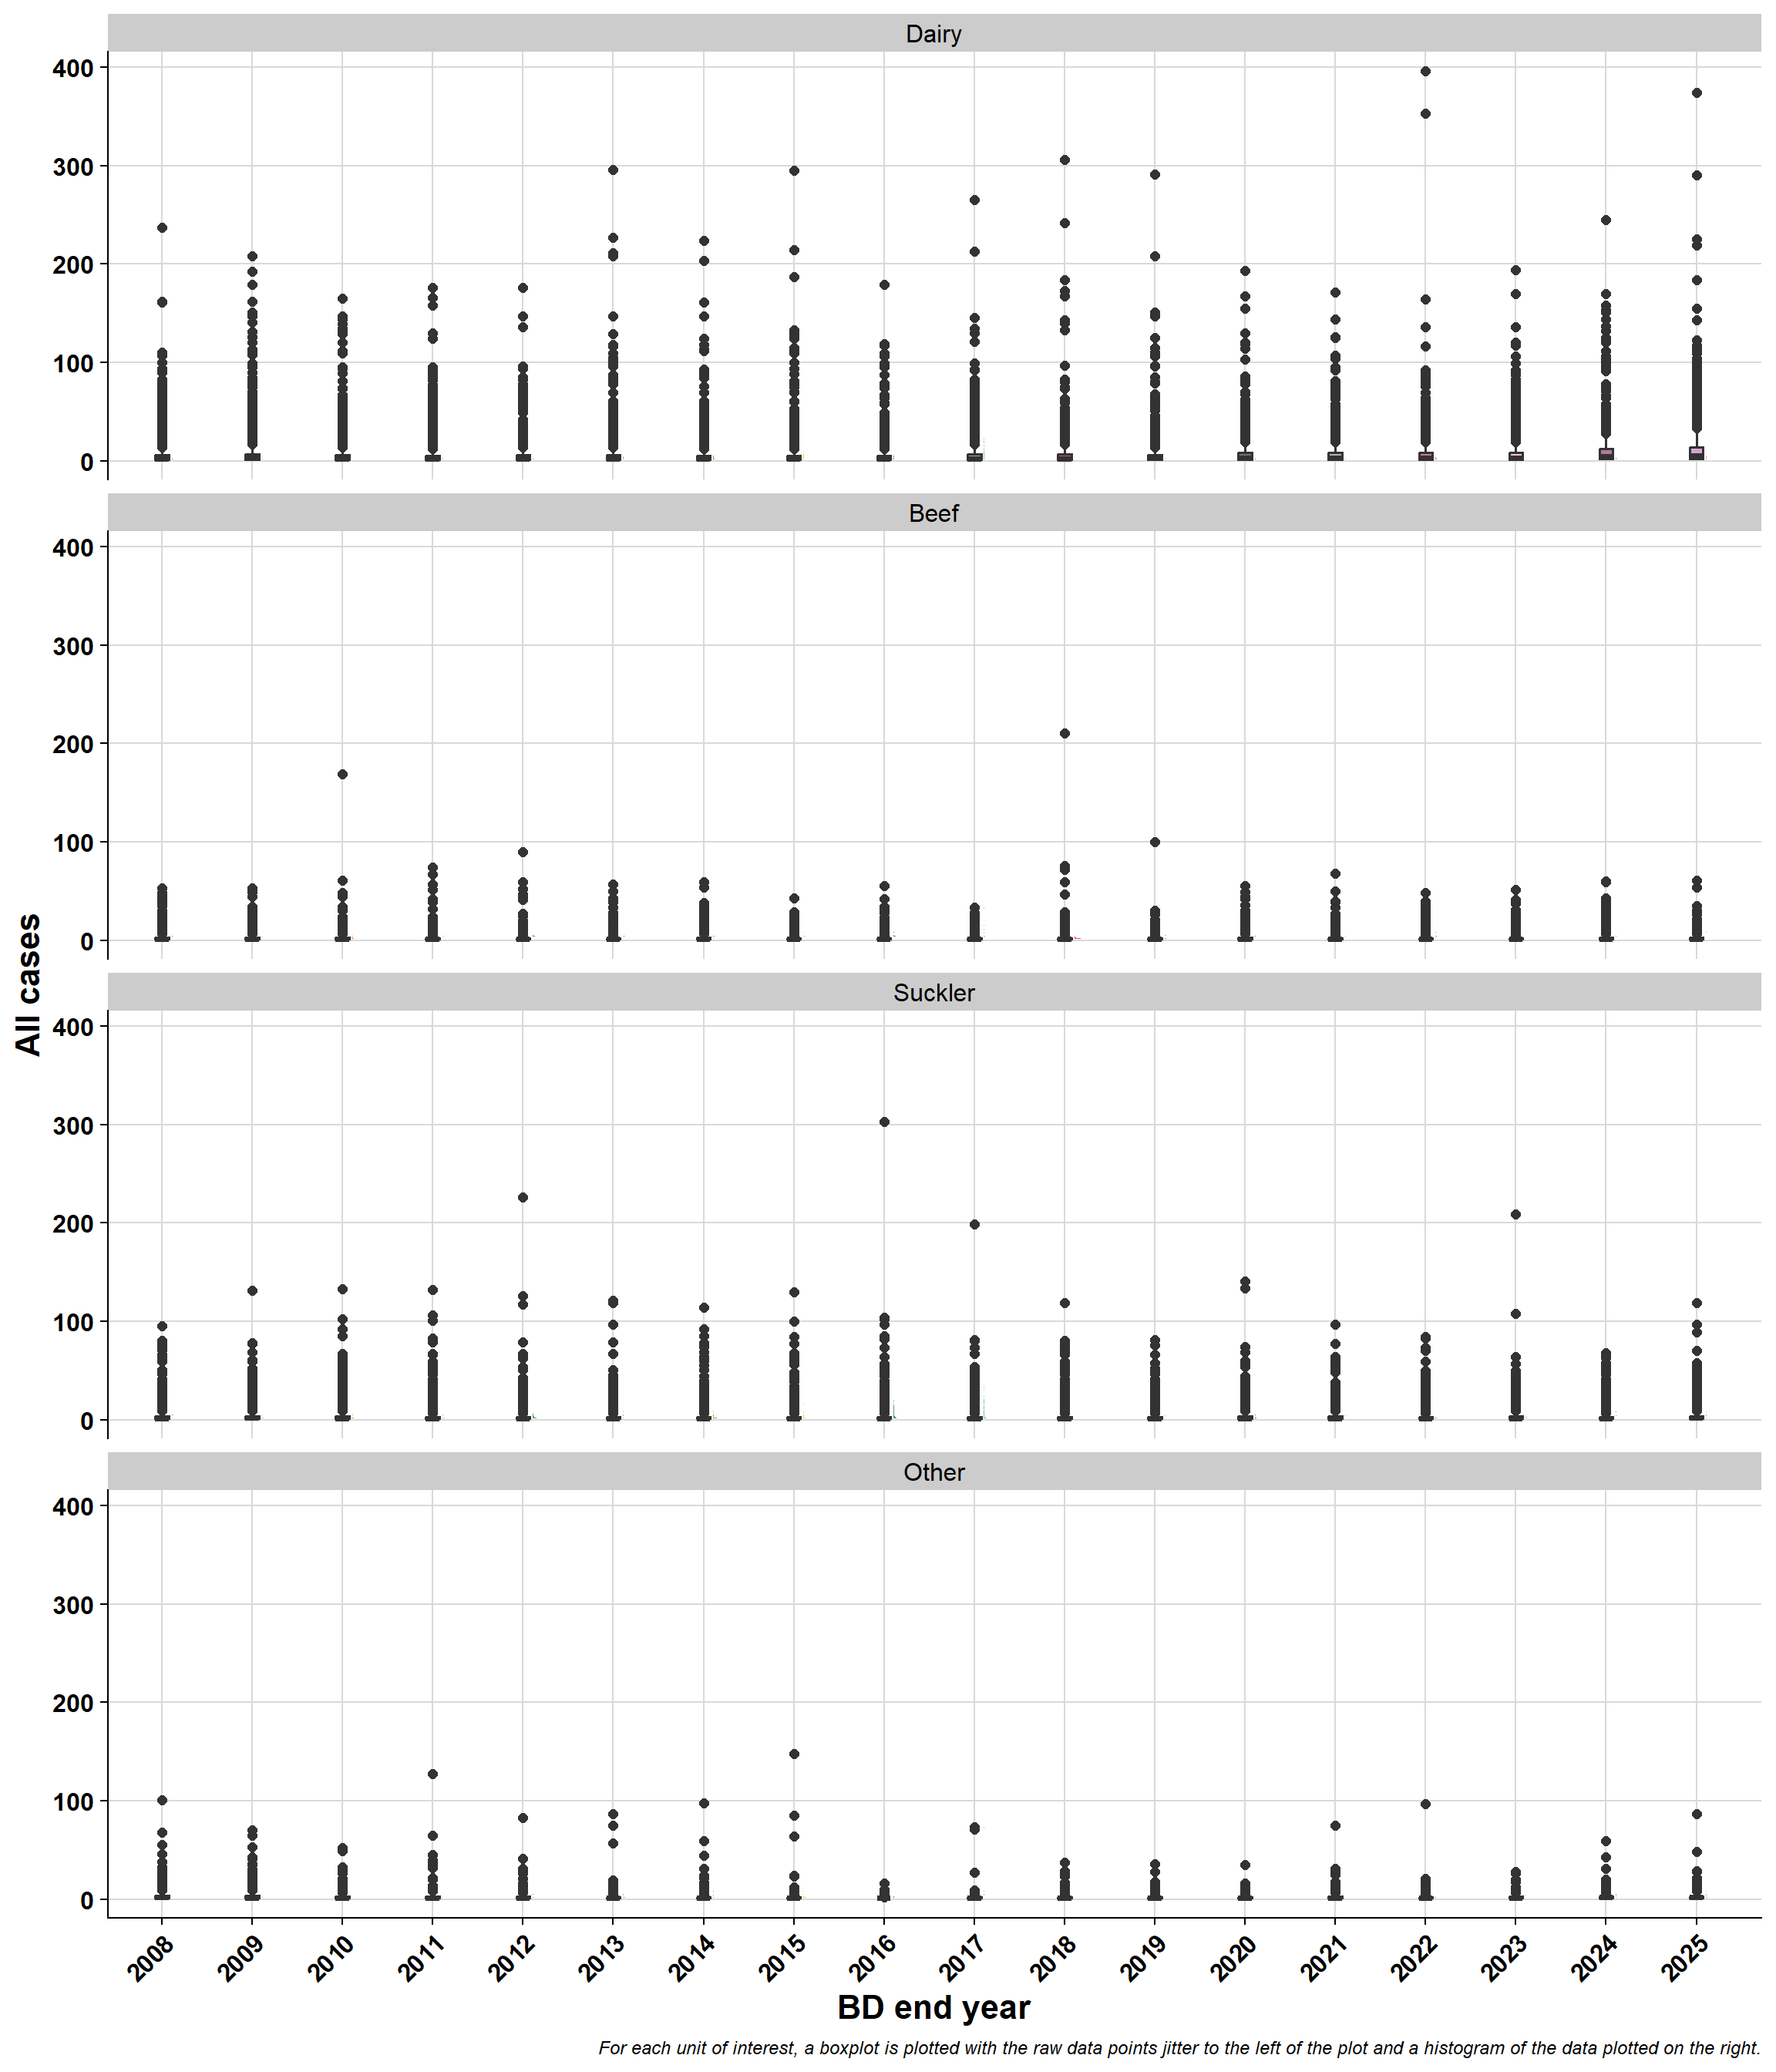
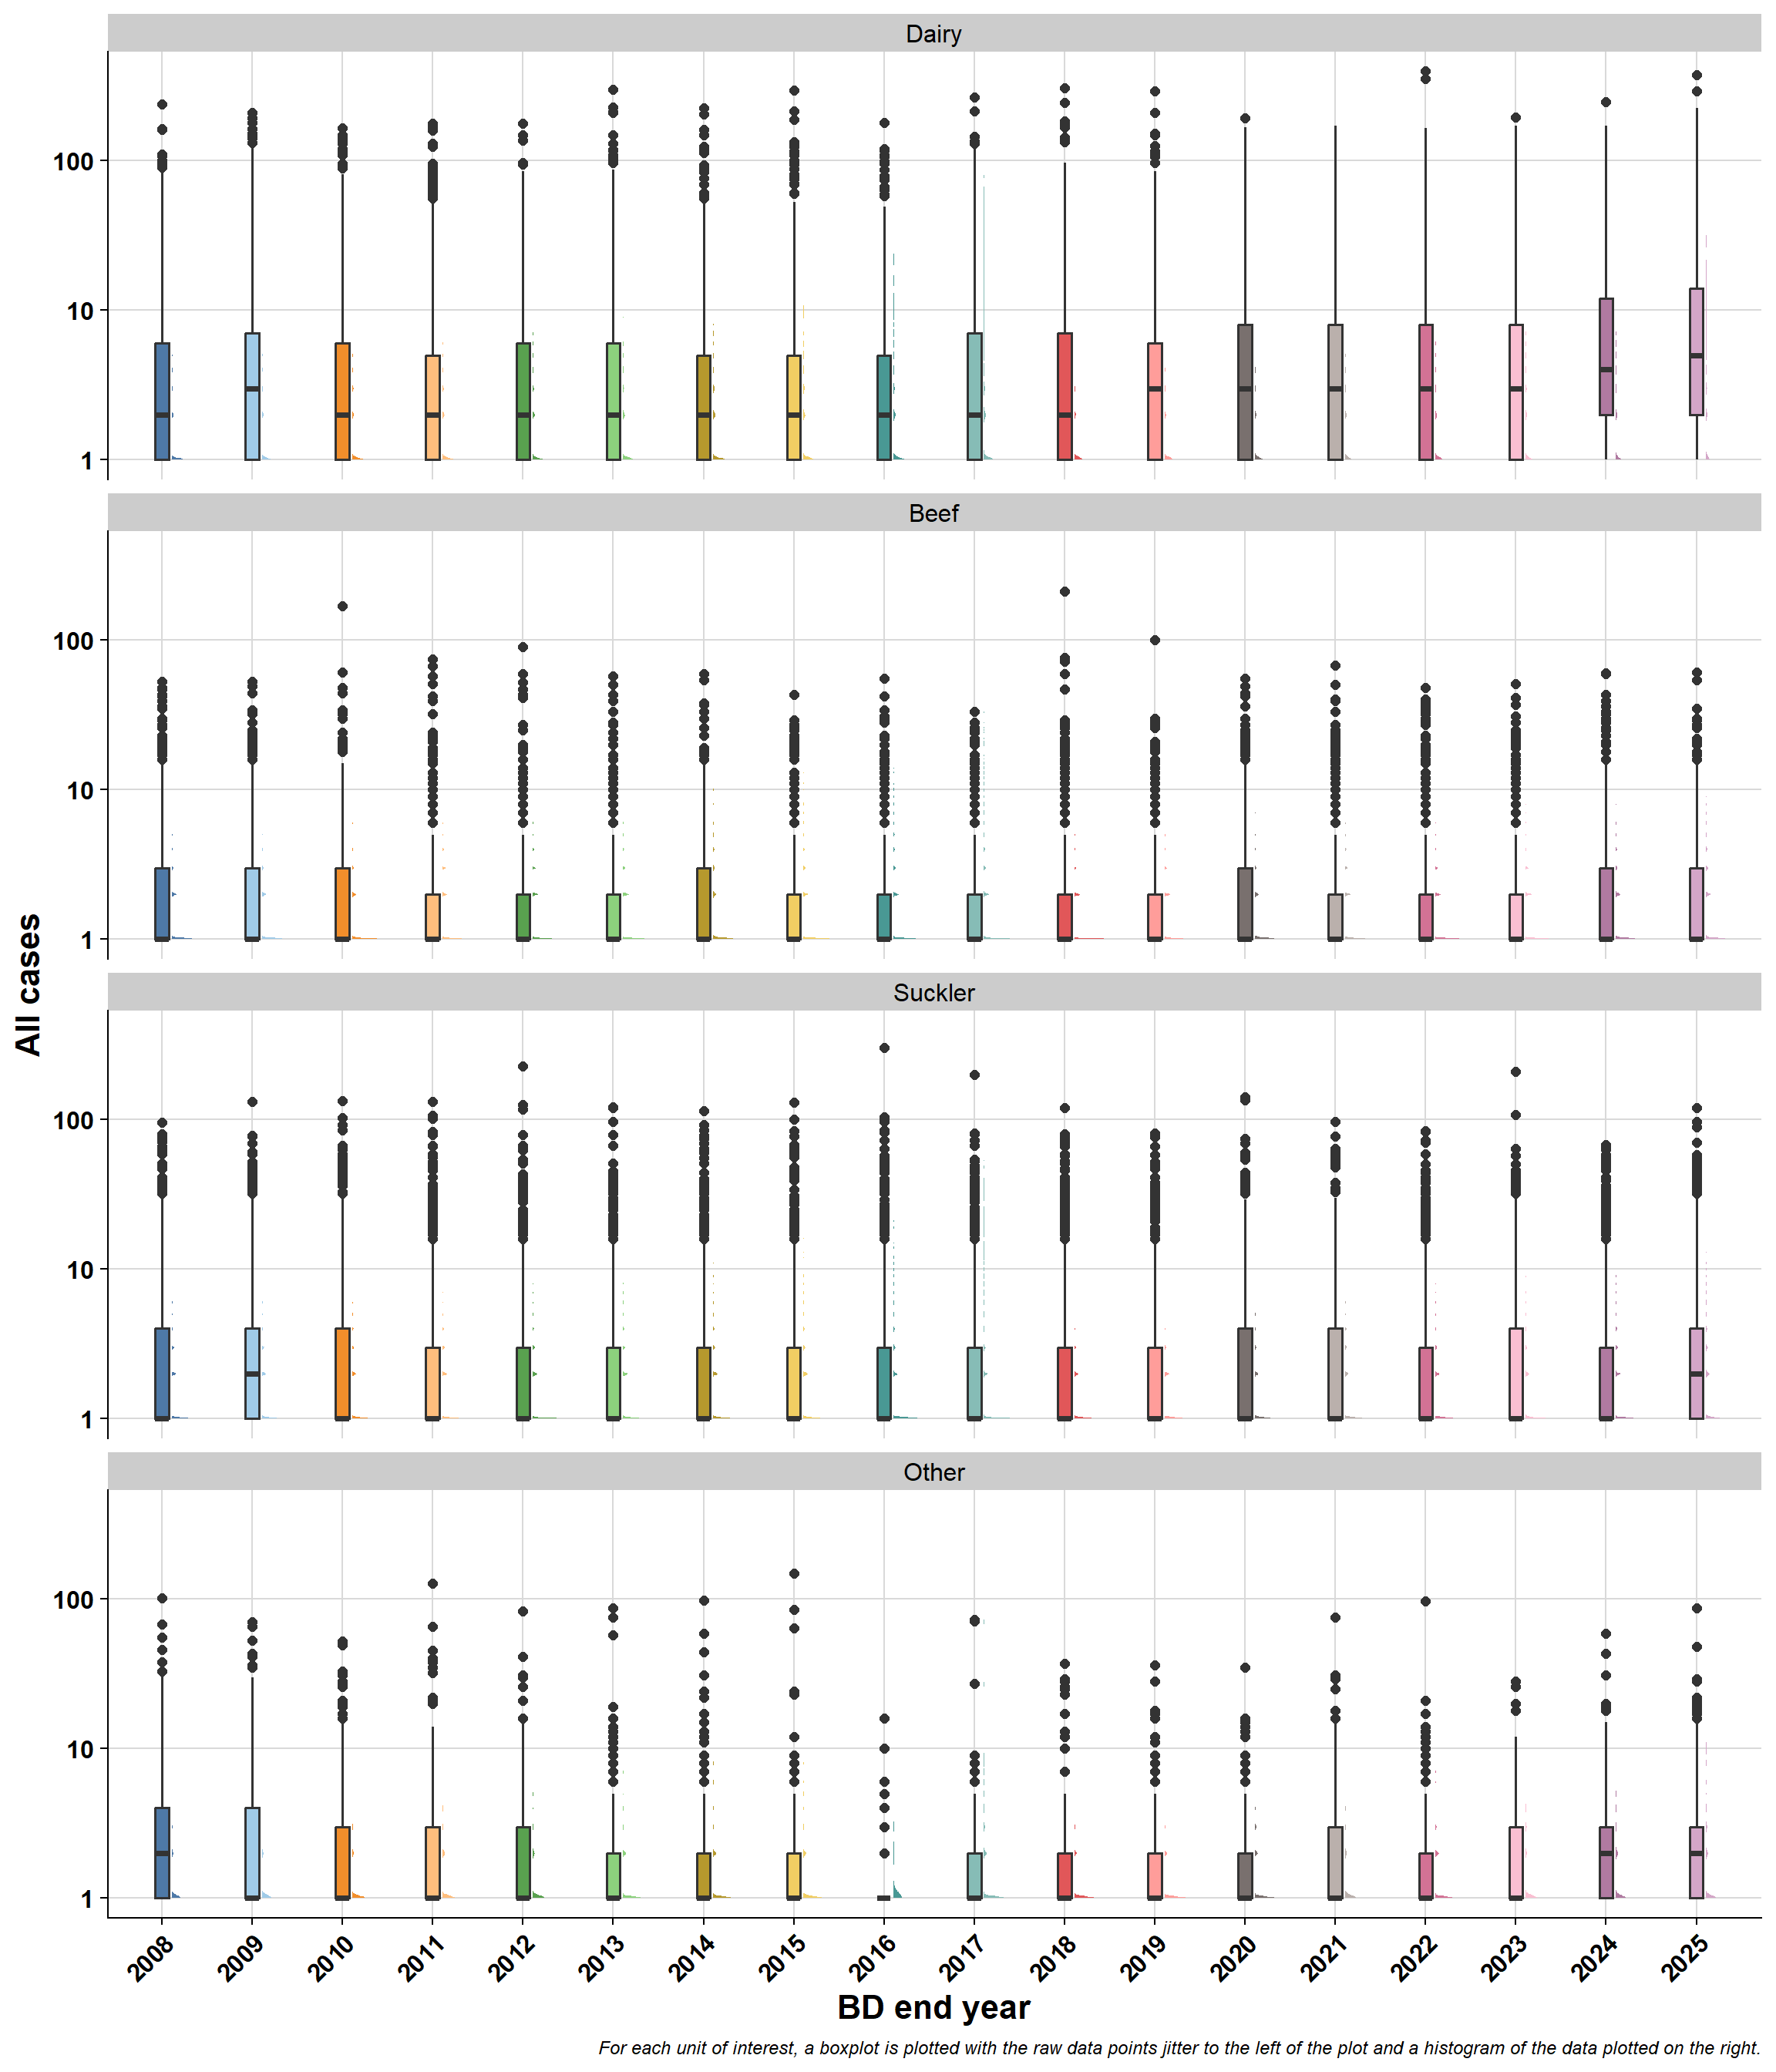
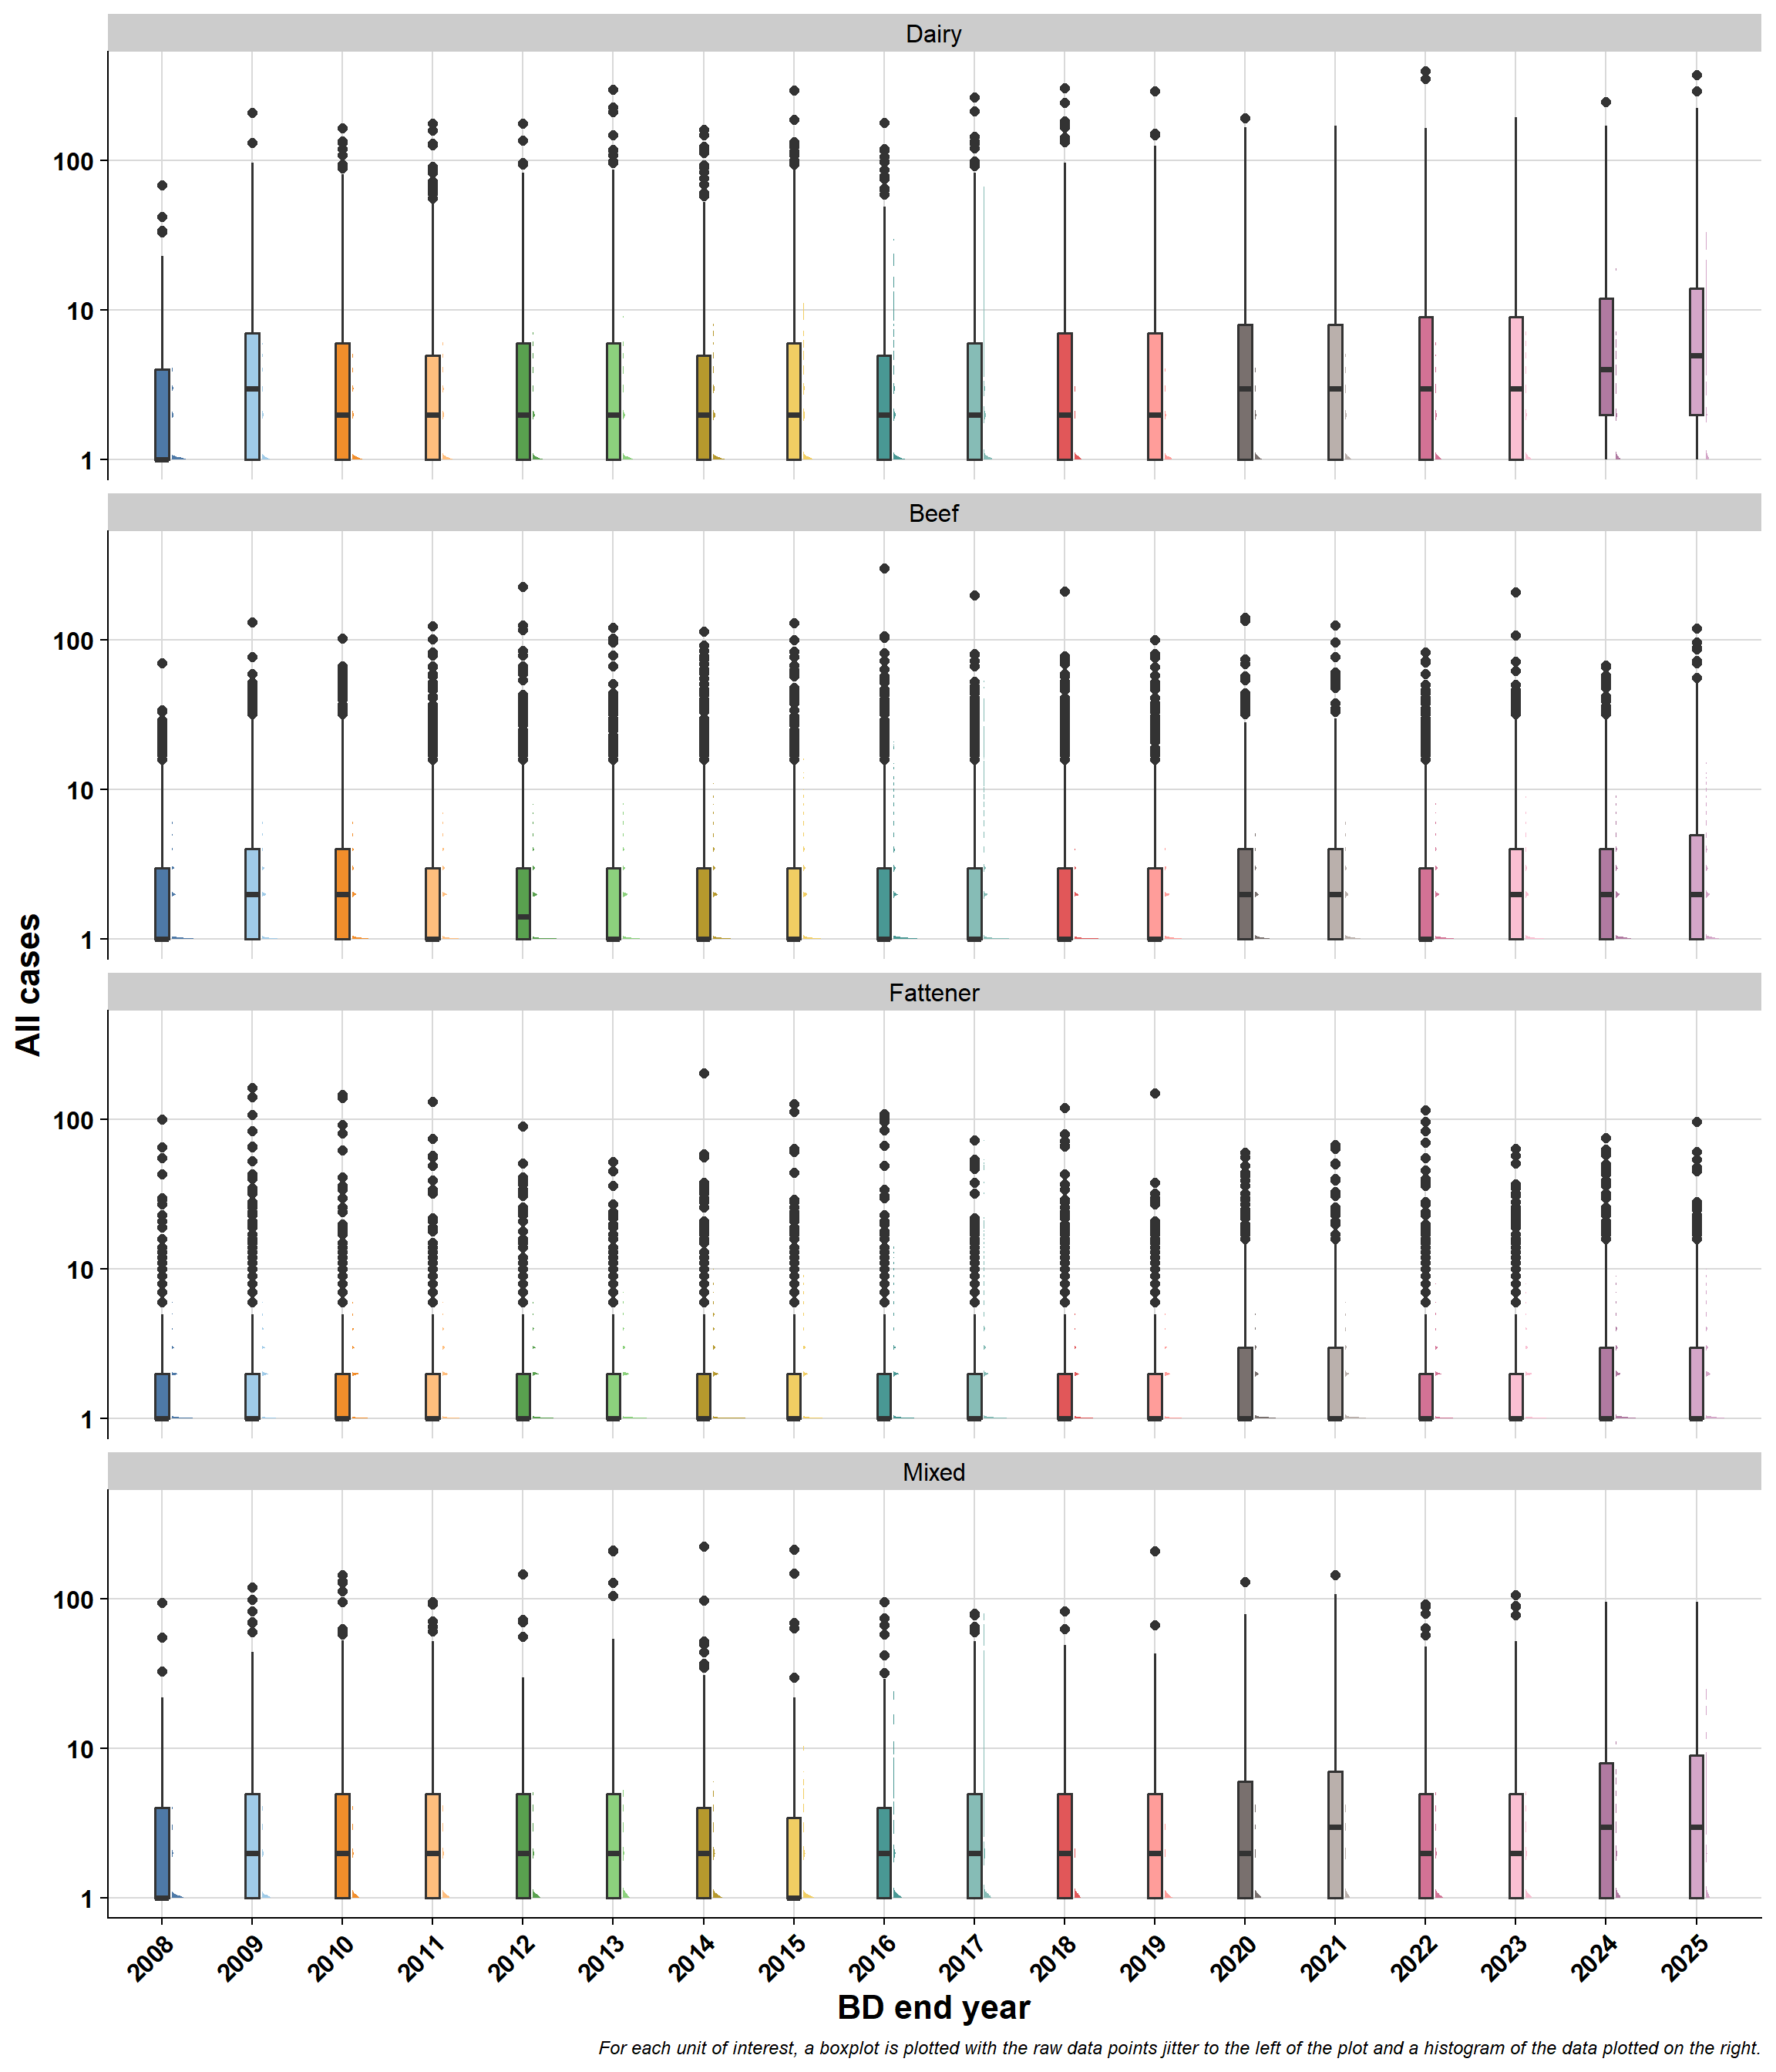
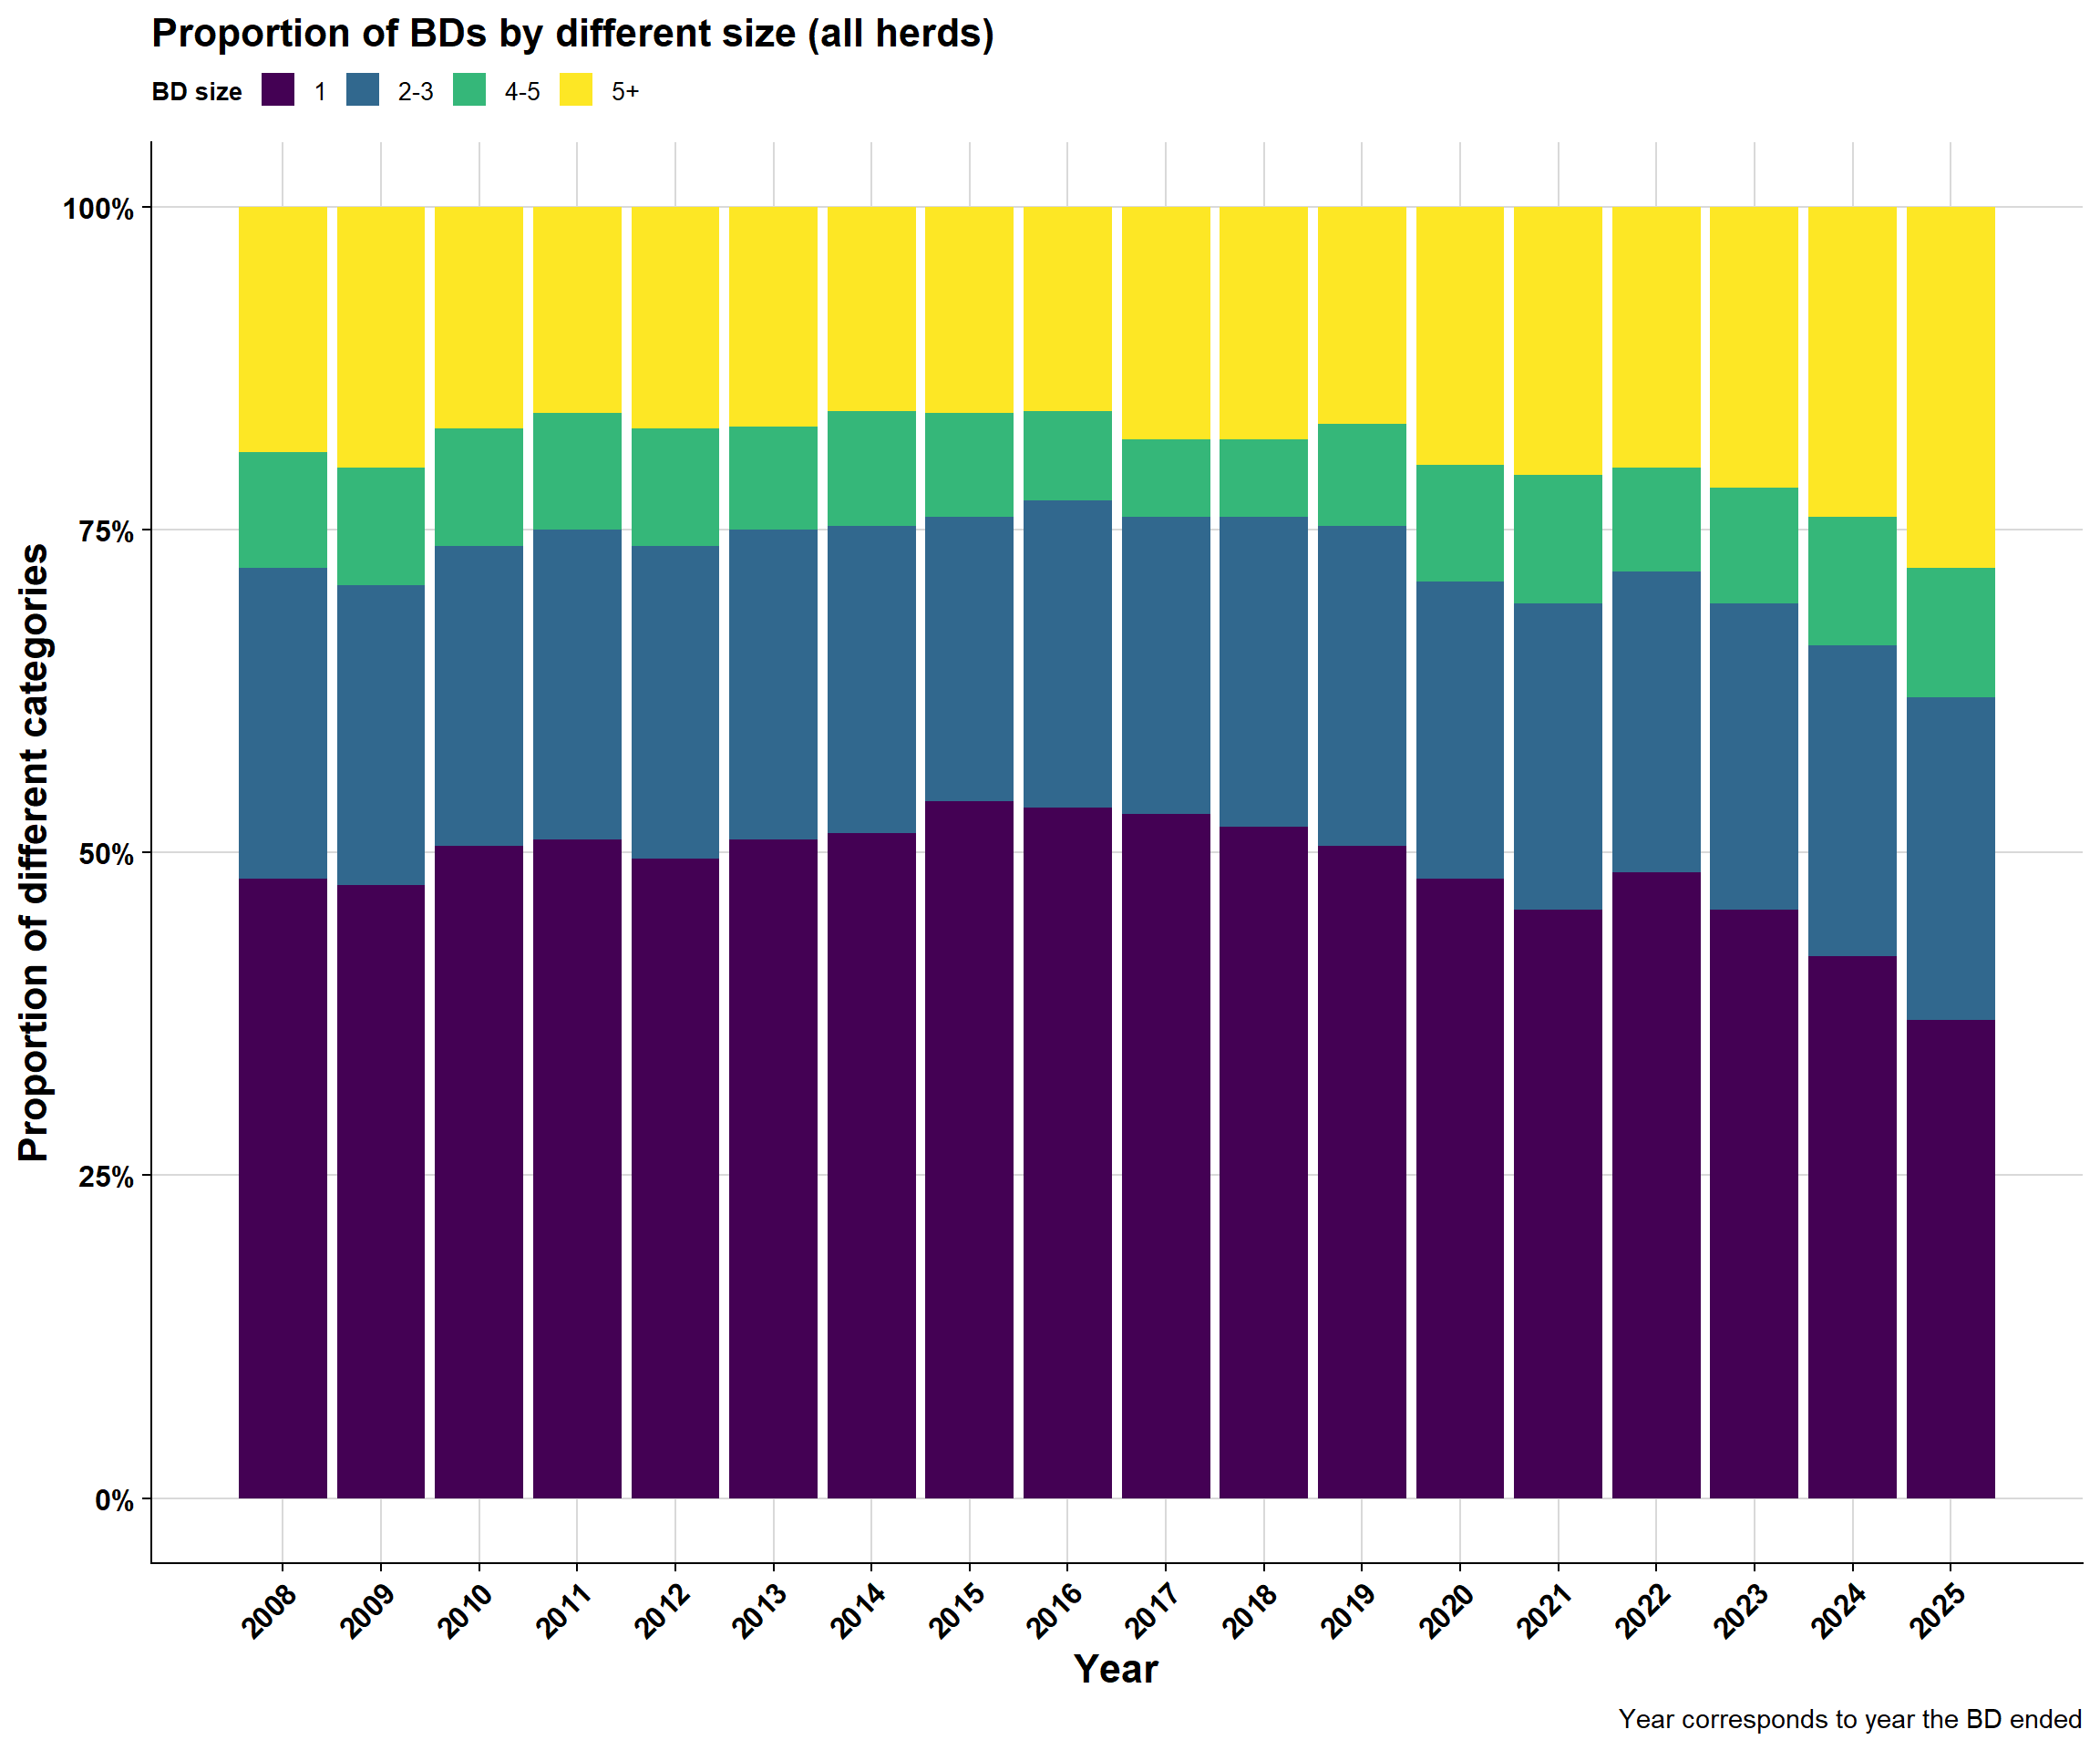
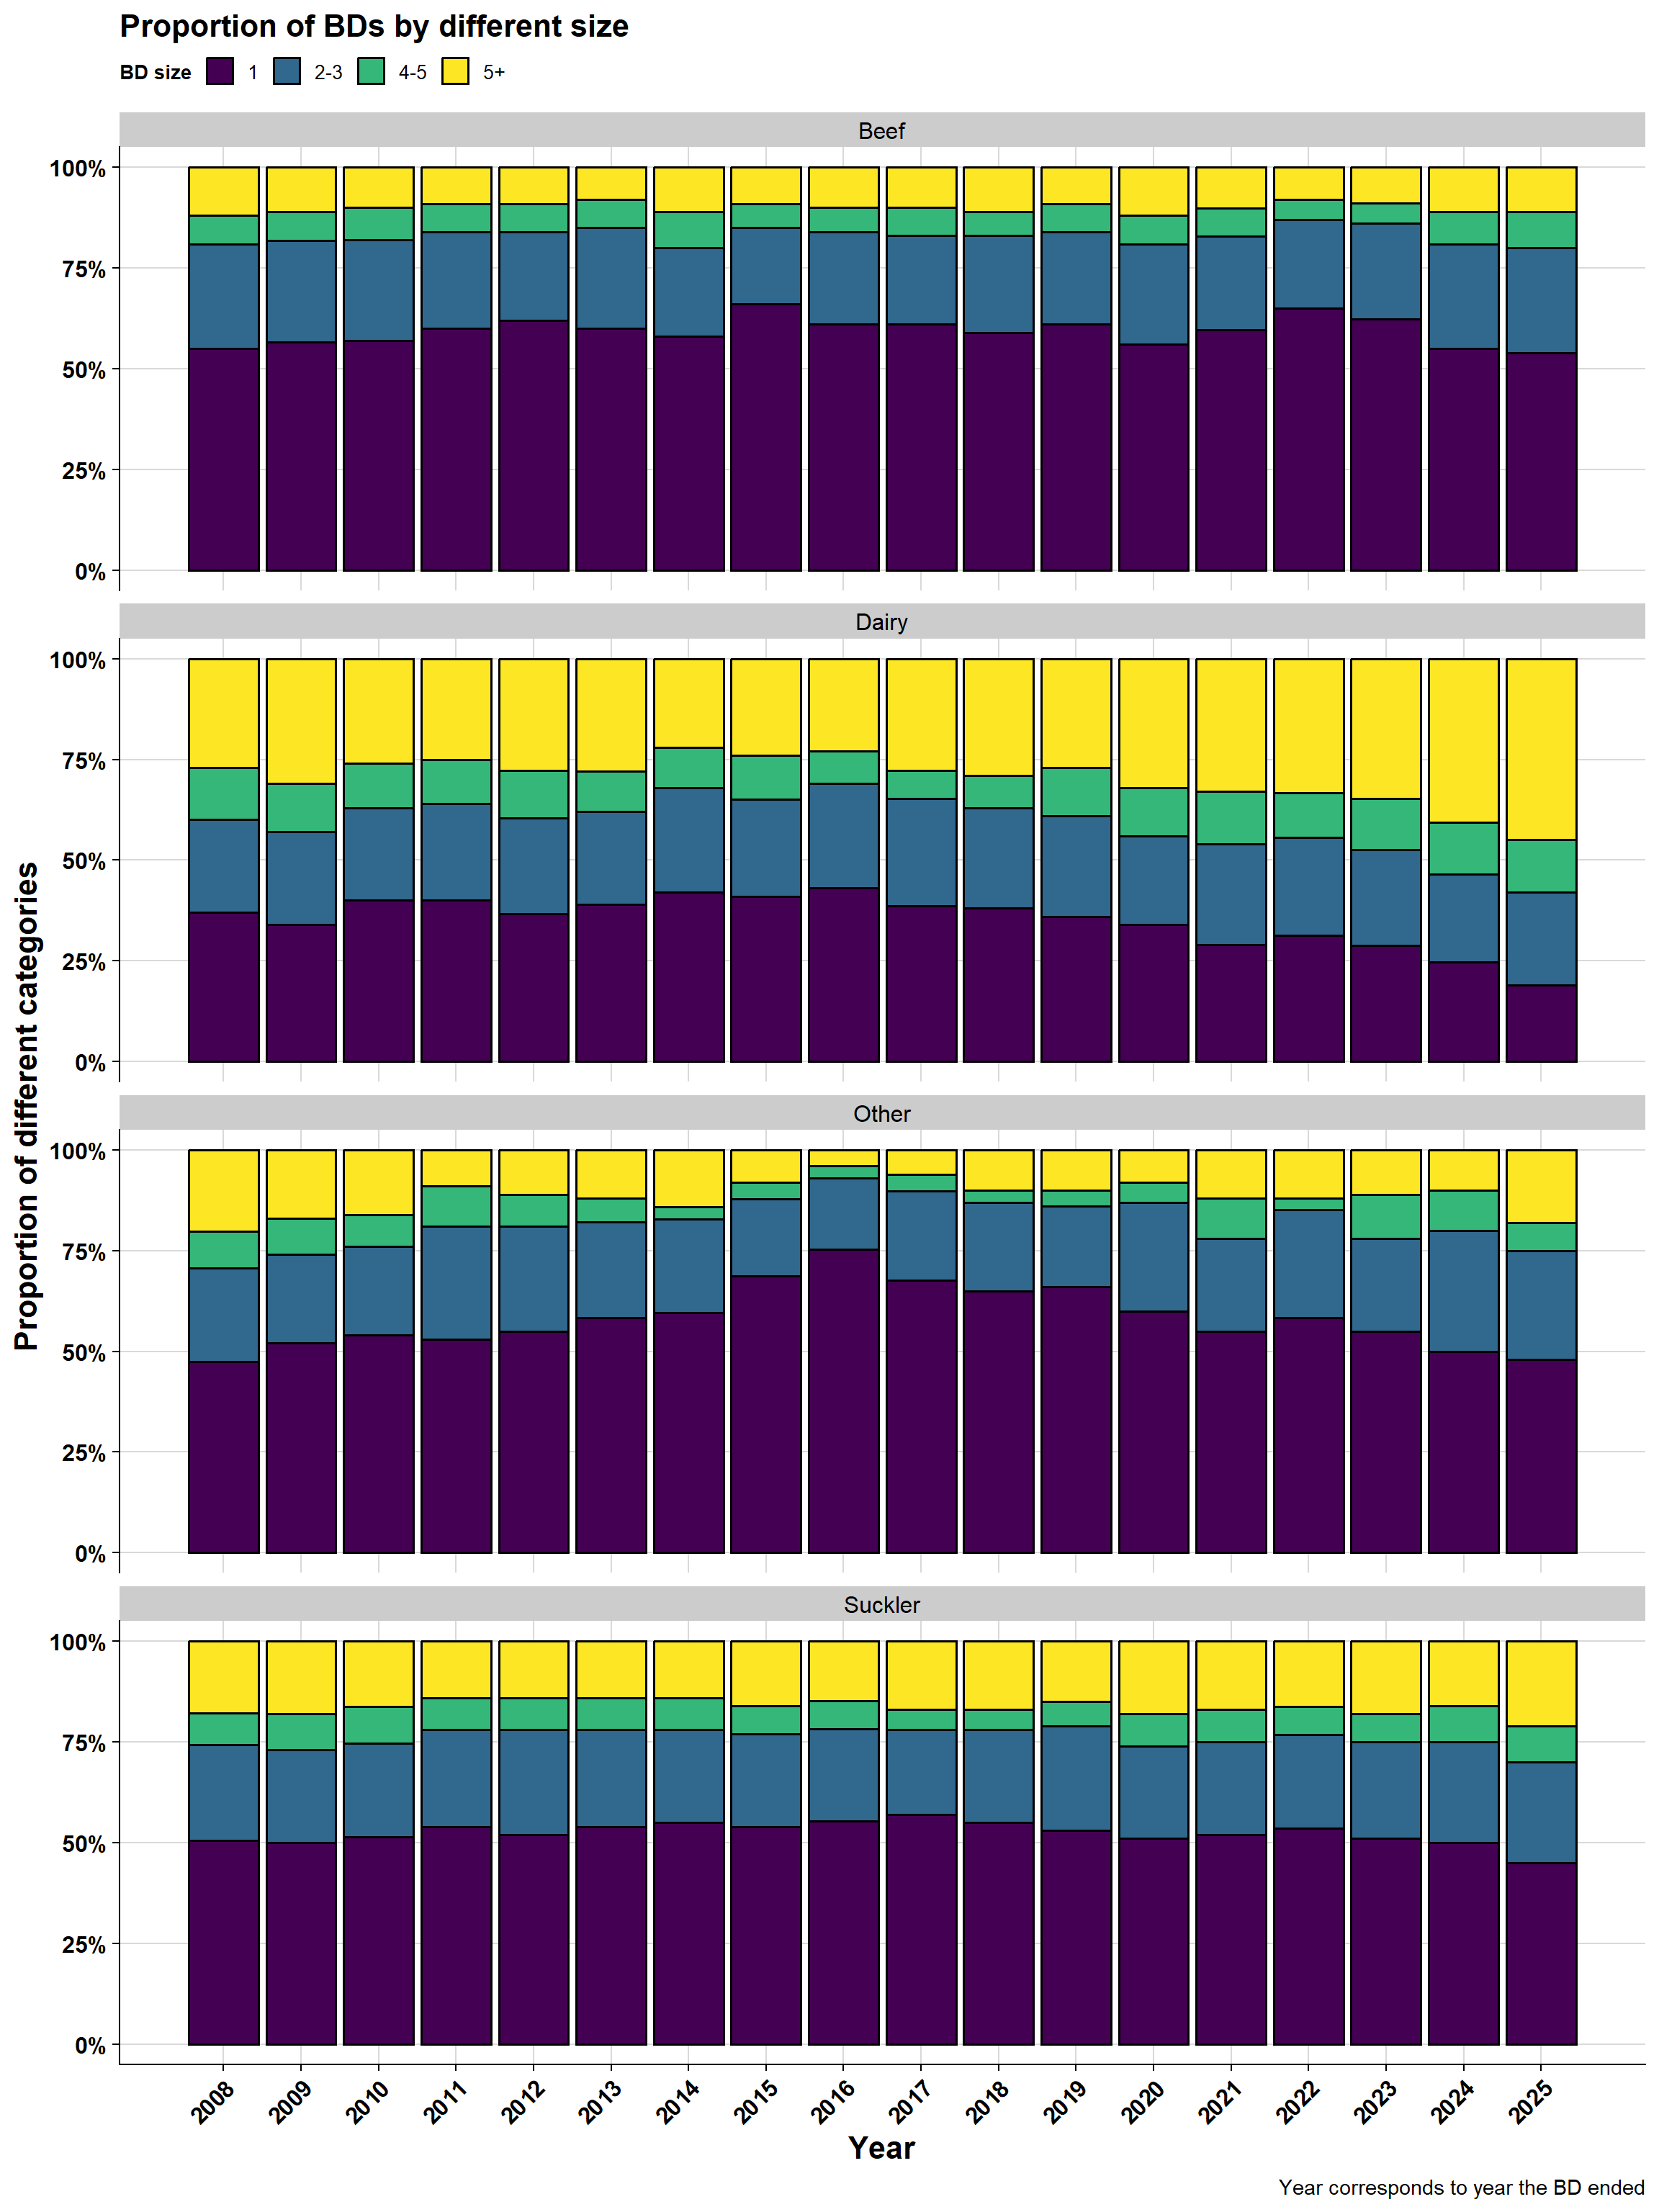
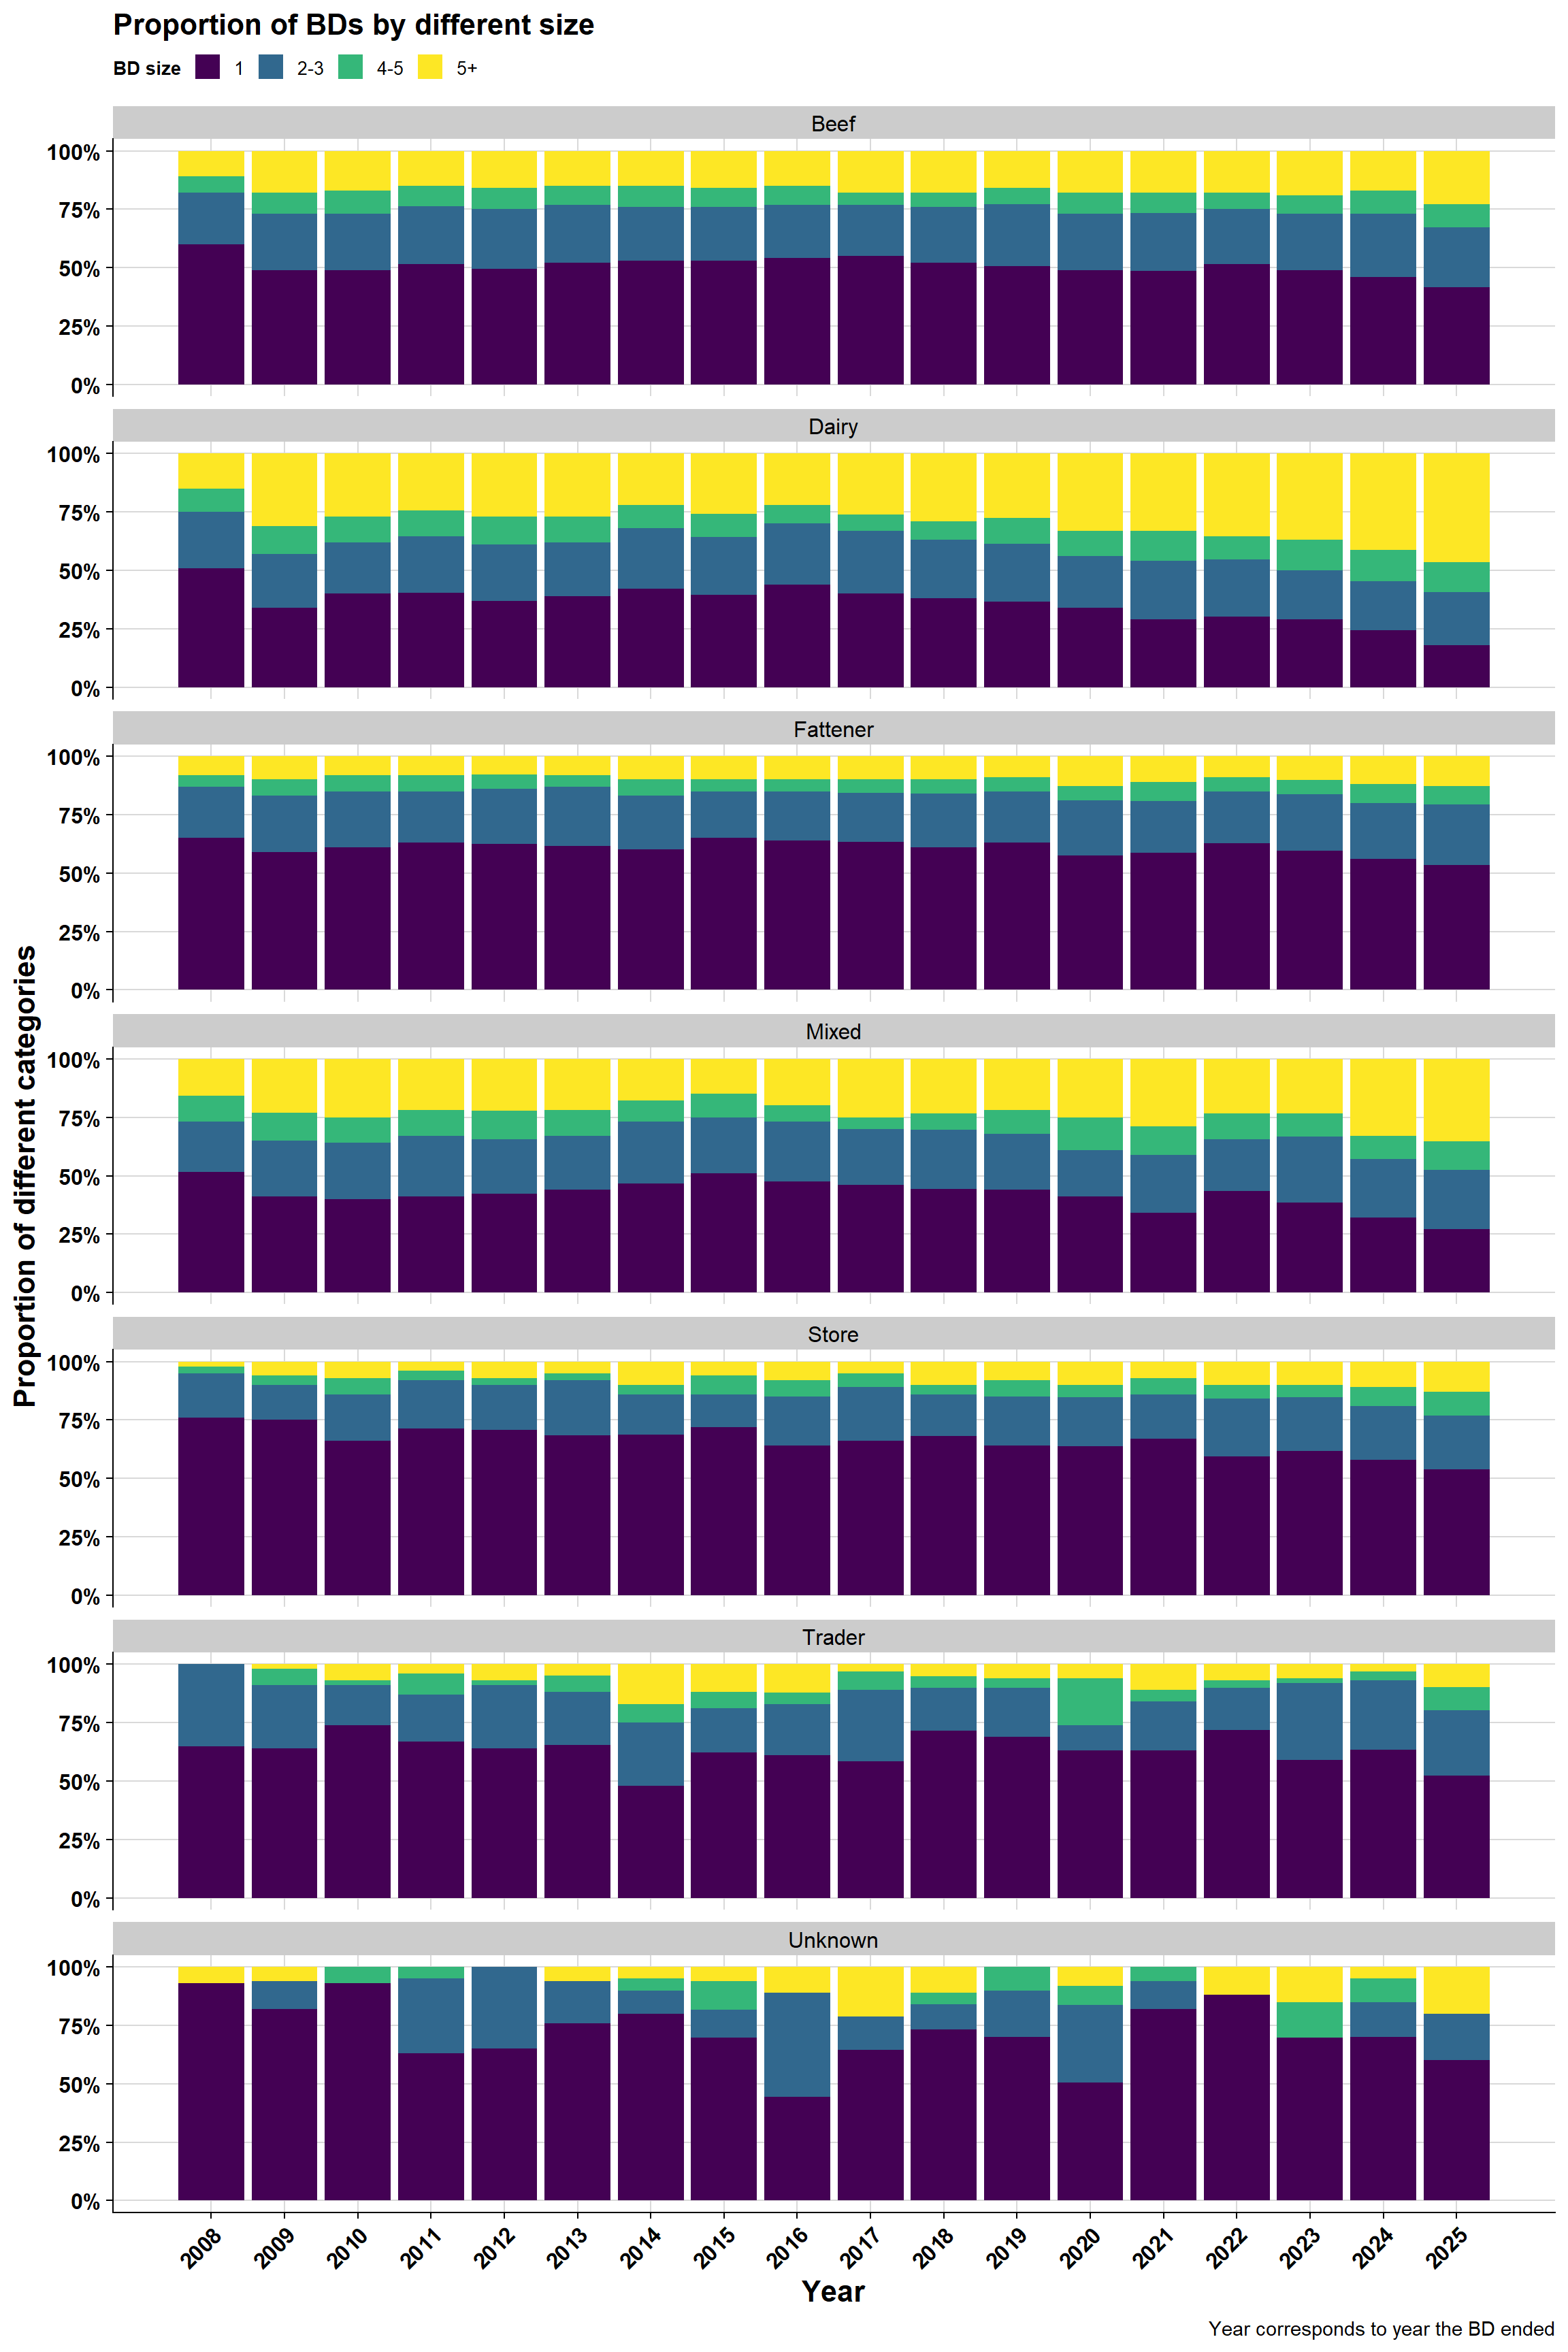
7.4 BD size
Here, we explore the number of bTB cases disclosed within herd BDs (i.e. BD size). This illustrates that BD size (e.g., median) is increasing particulaly within dairy herds. The variance in the number of cases within BDs is also increasing within dairy. Mixed herd-types are also increasing in size (these are herds that have a component of their herd as dairy). The fact that dairy herds have more bTB cases during a BD is not that surprising as dairy are also the herds with the largest number of animals (herd size **add link here) in their herd.
\(~\) \(~\)
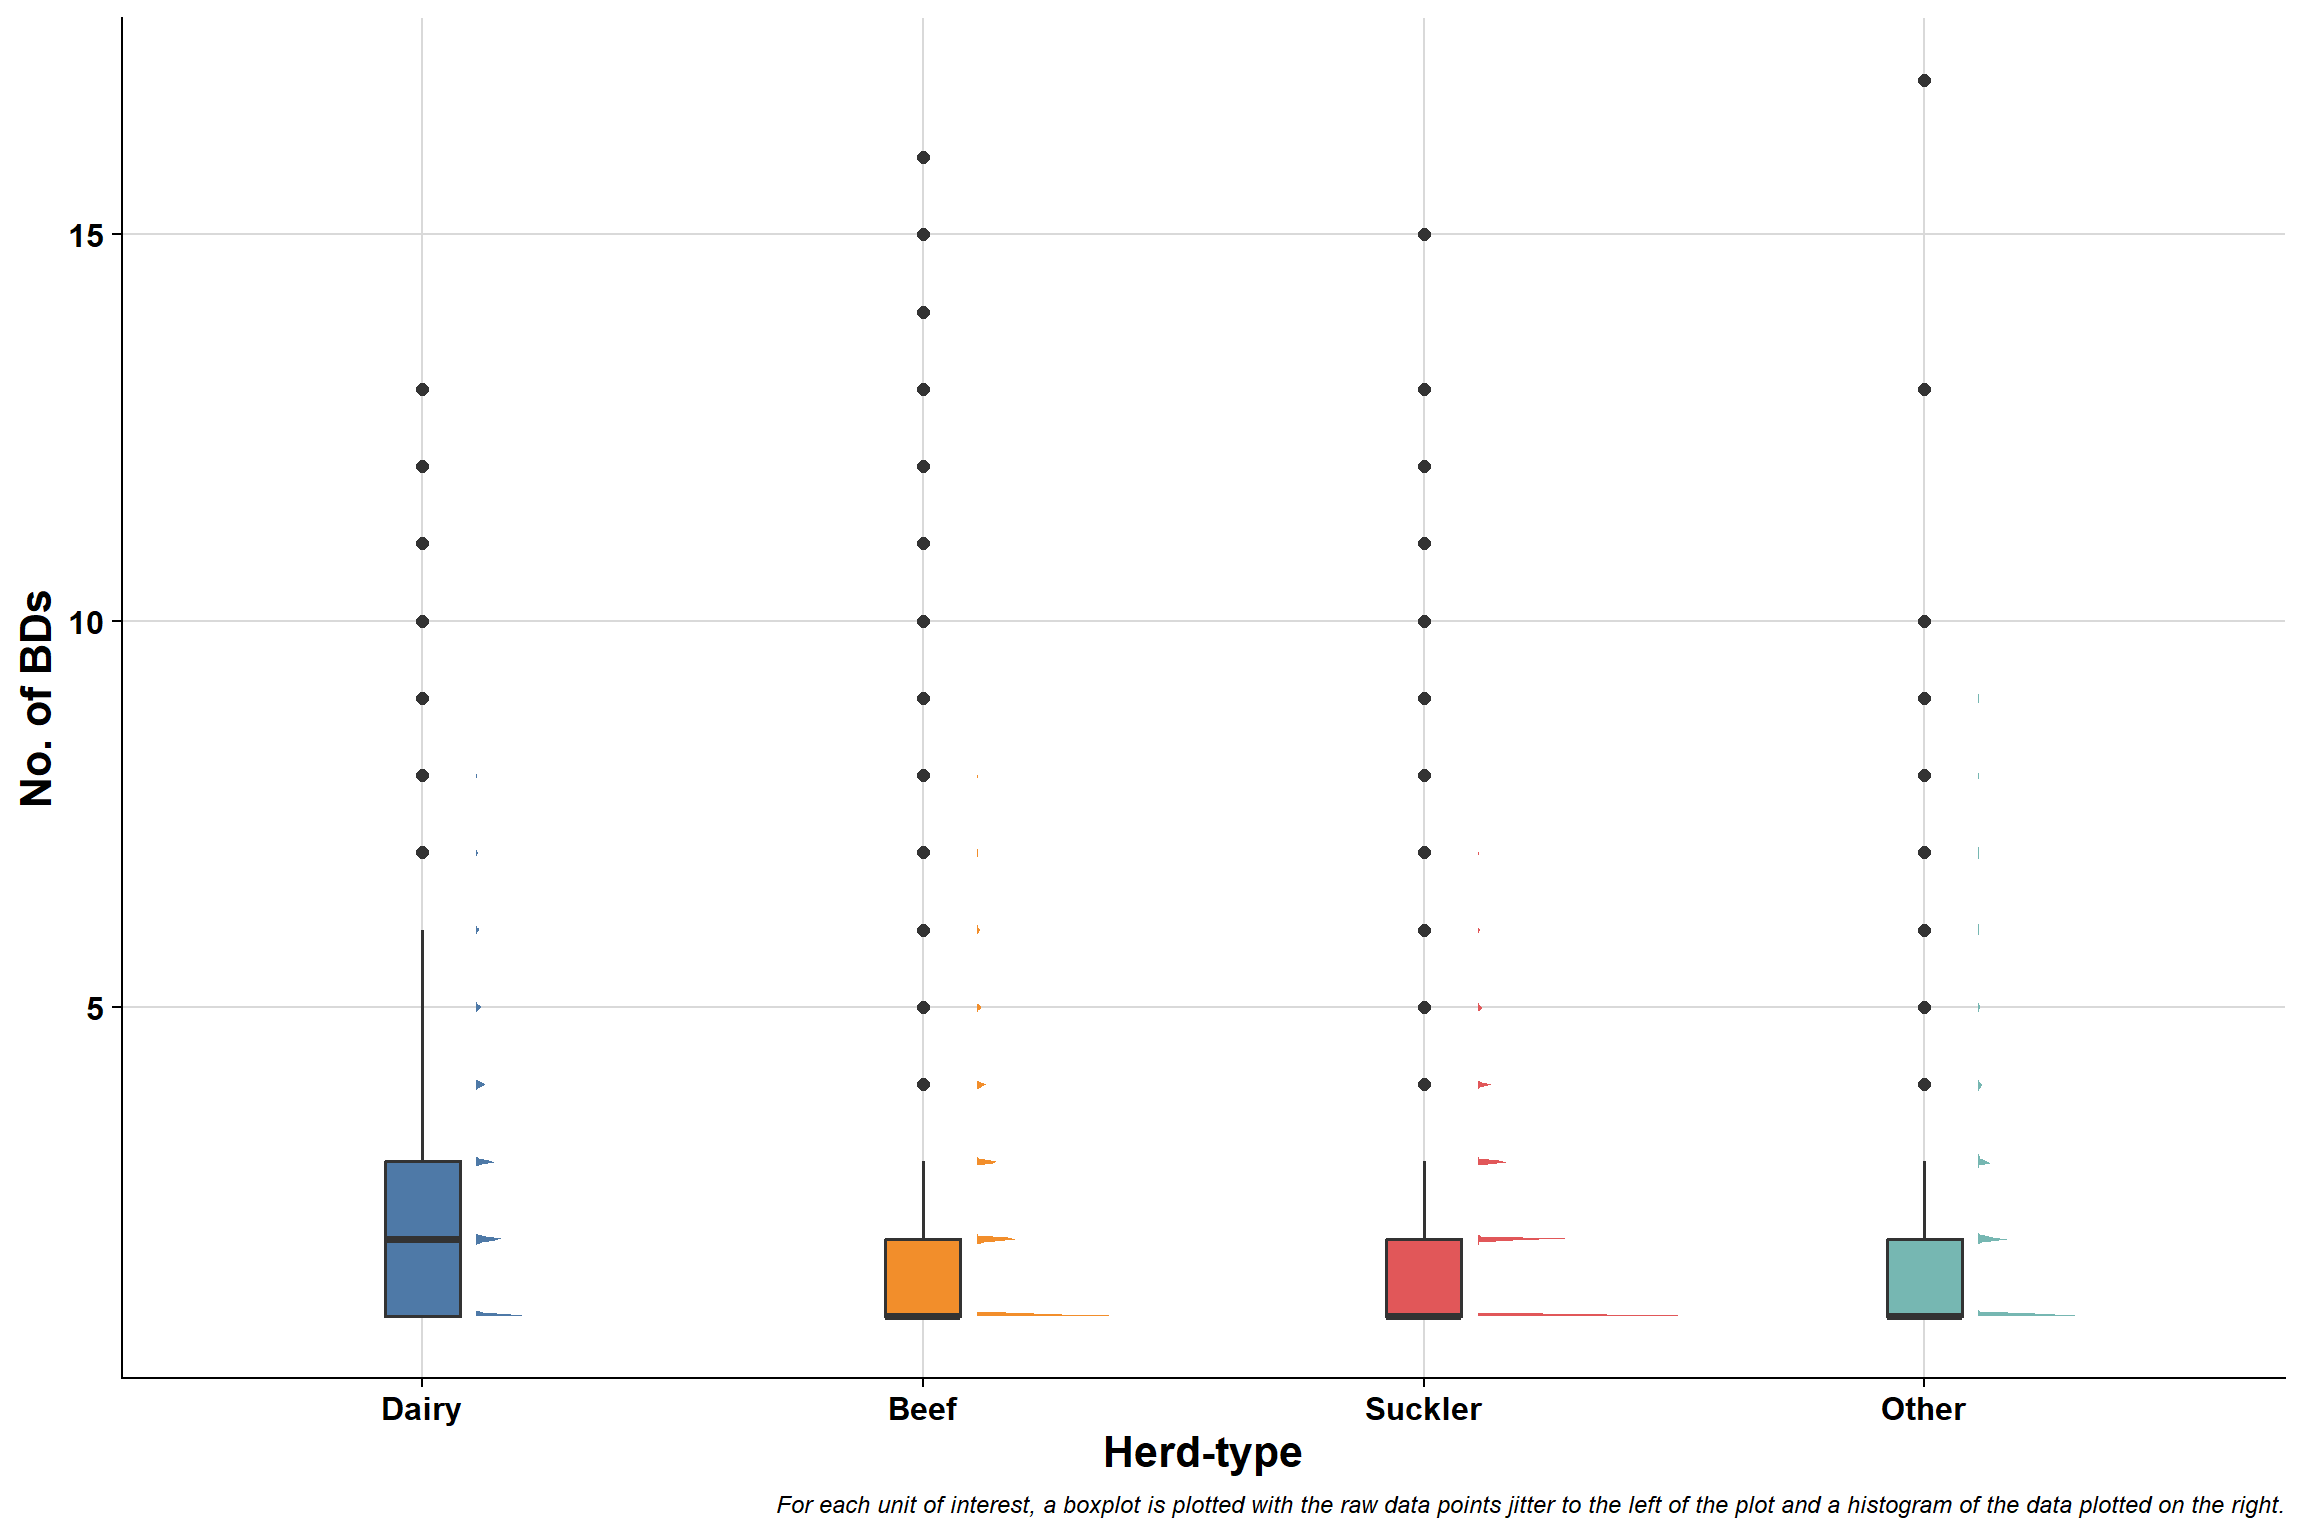
7.4.1 AHCS herd-type by BD size
\(~\)
\(~\)
\(~\)
\(~\) \(~\)
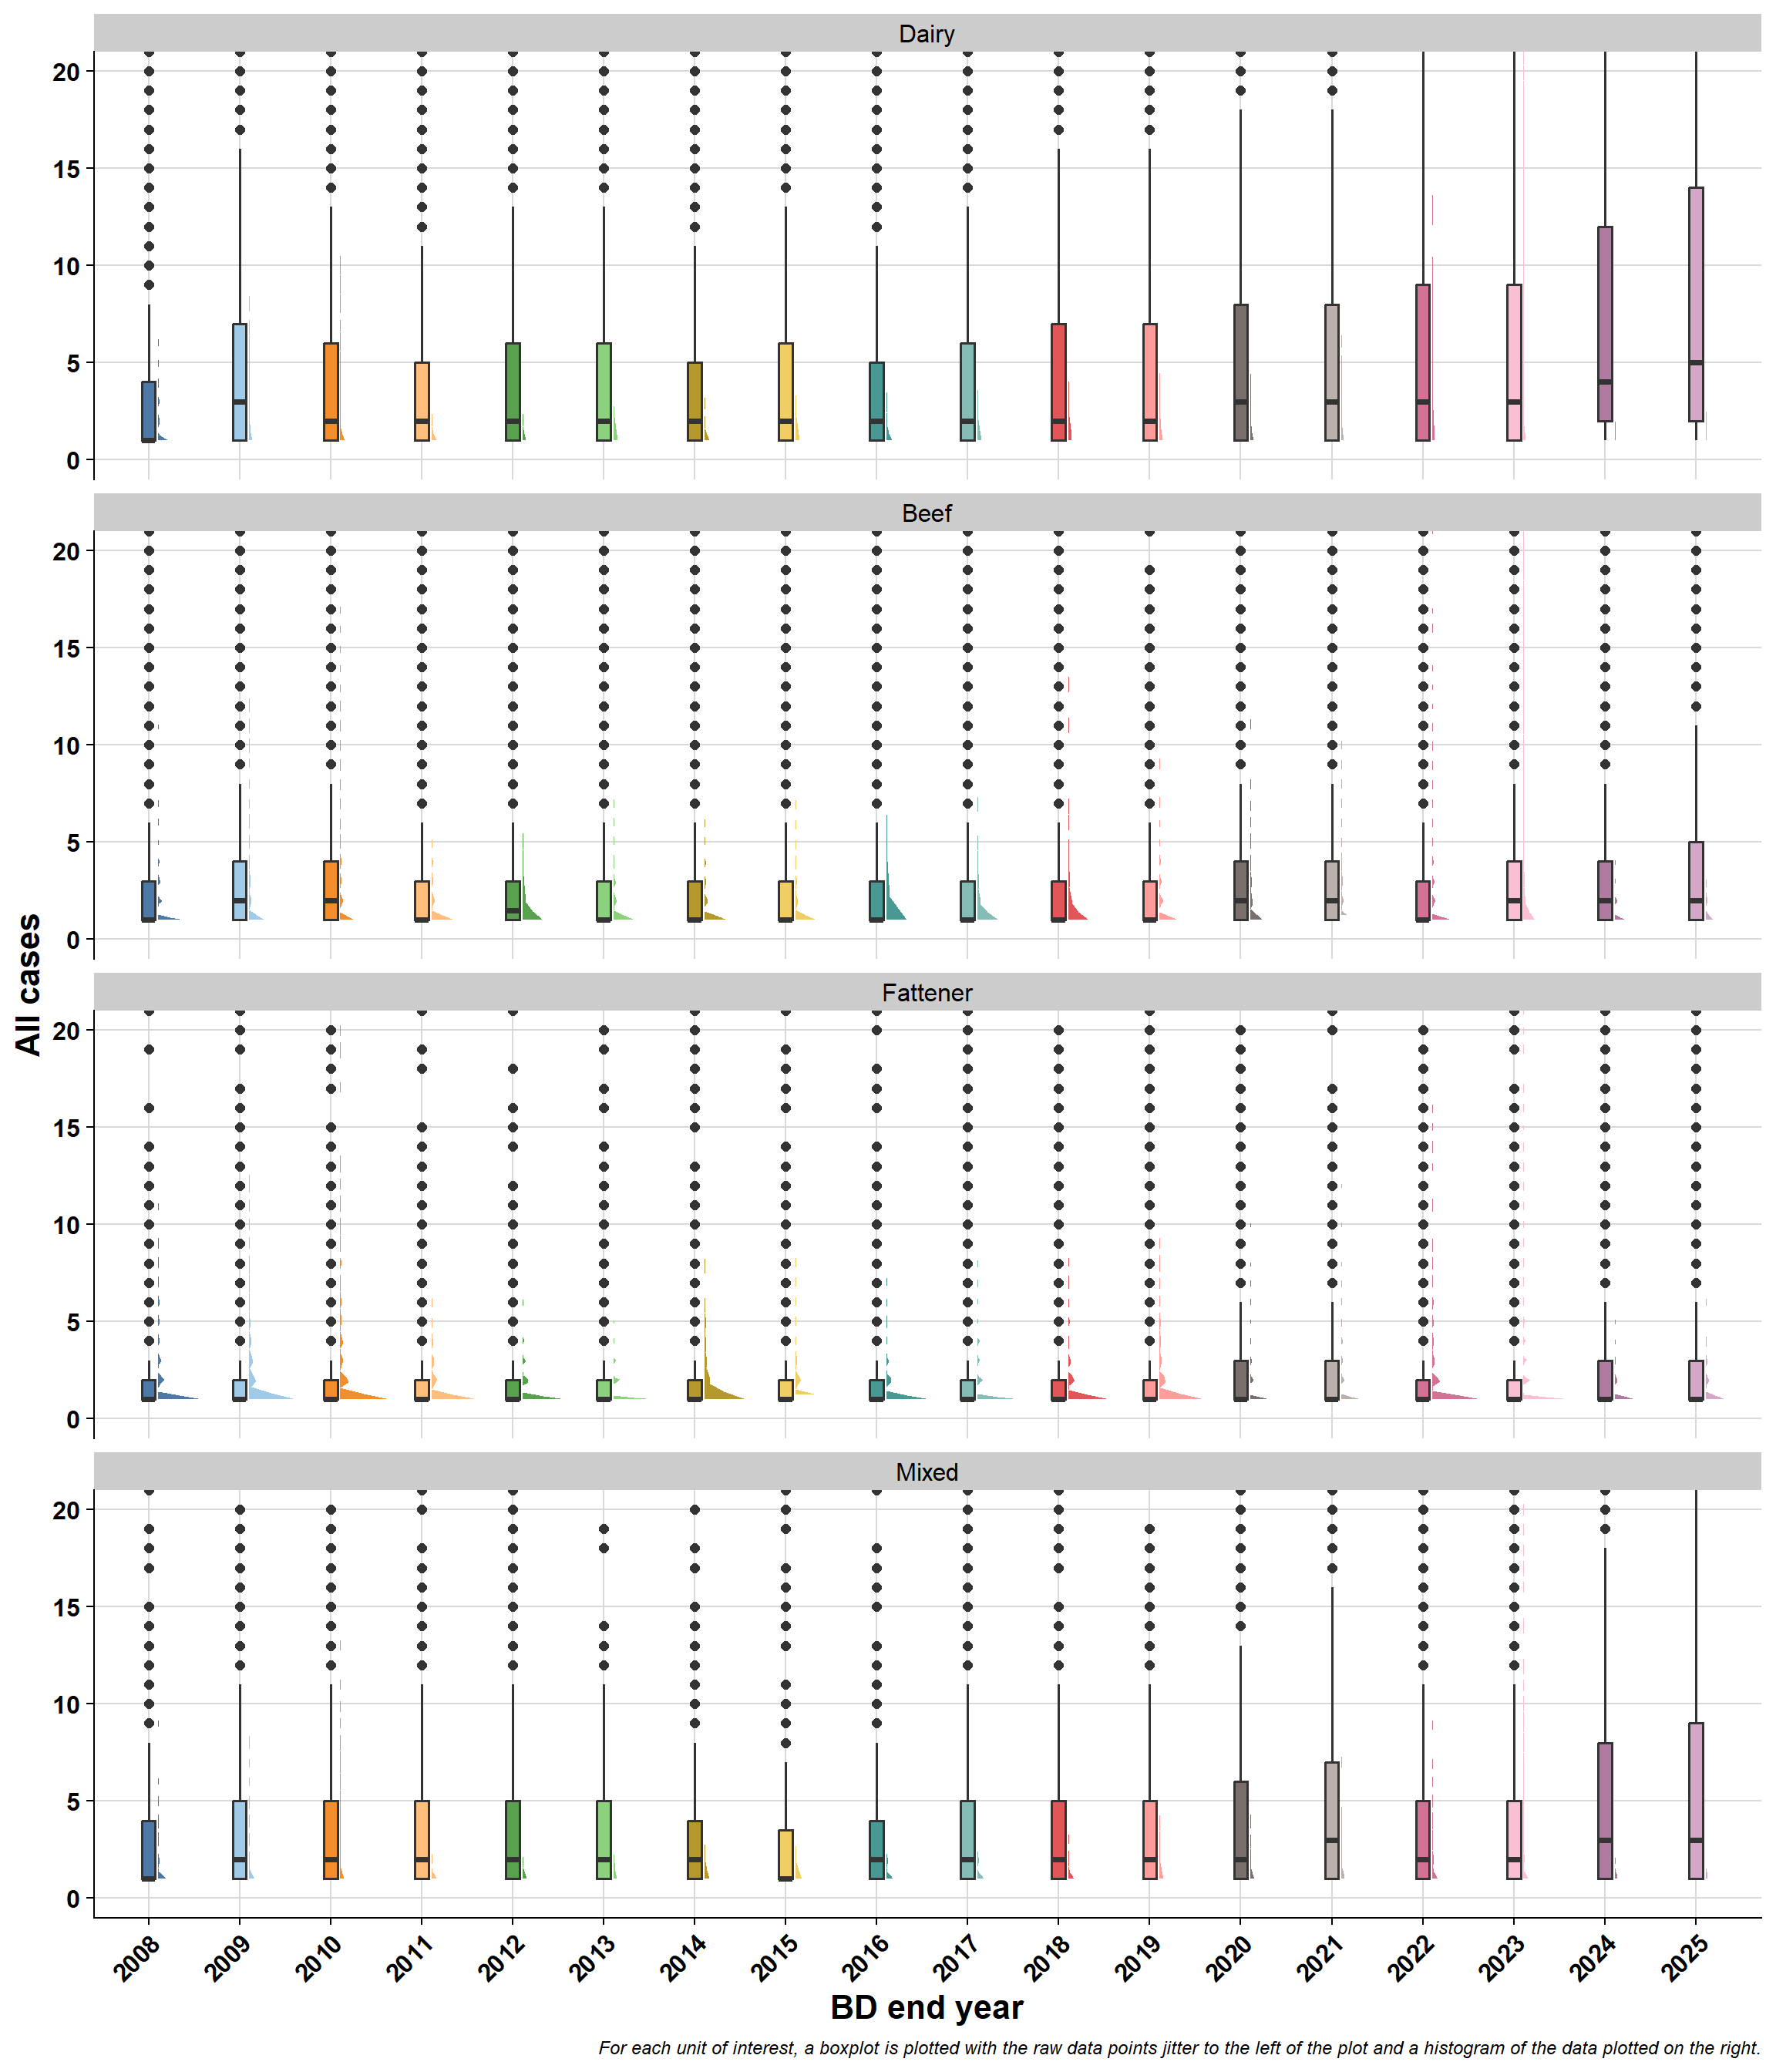
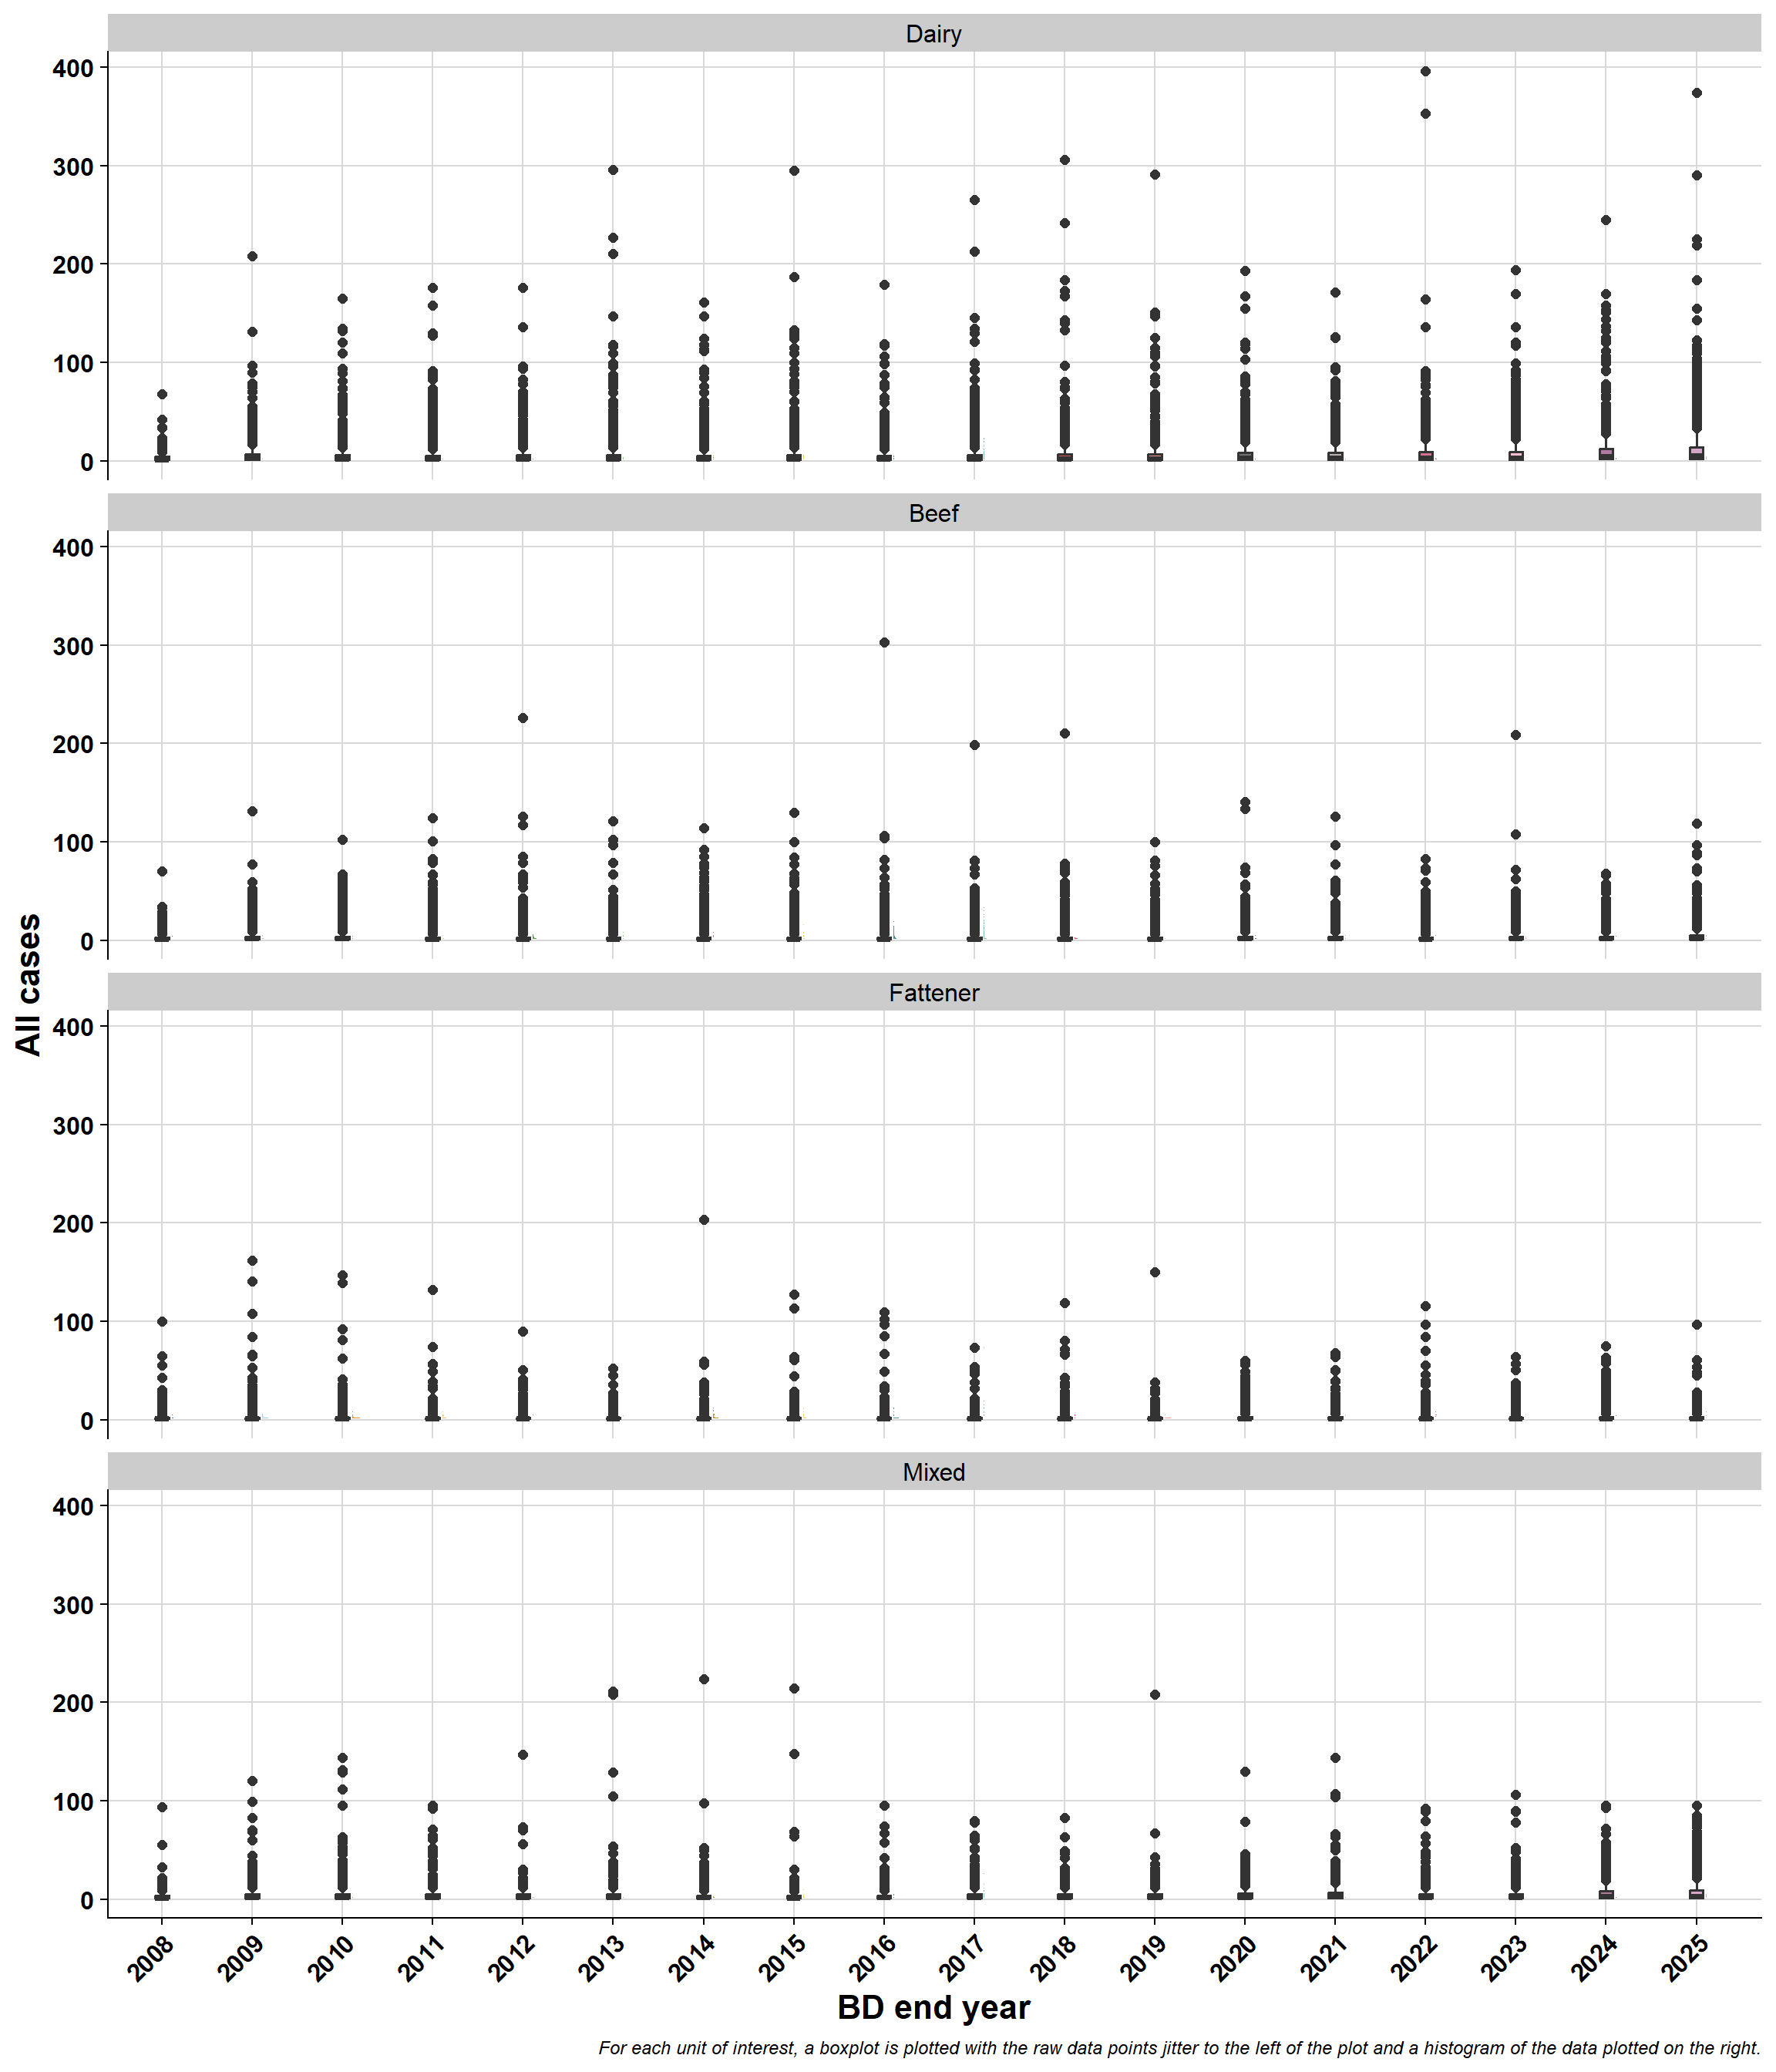
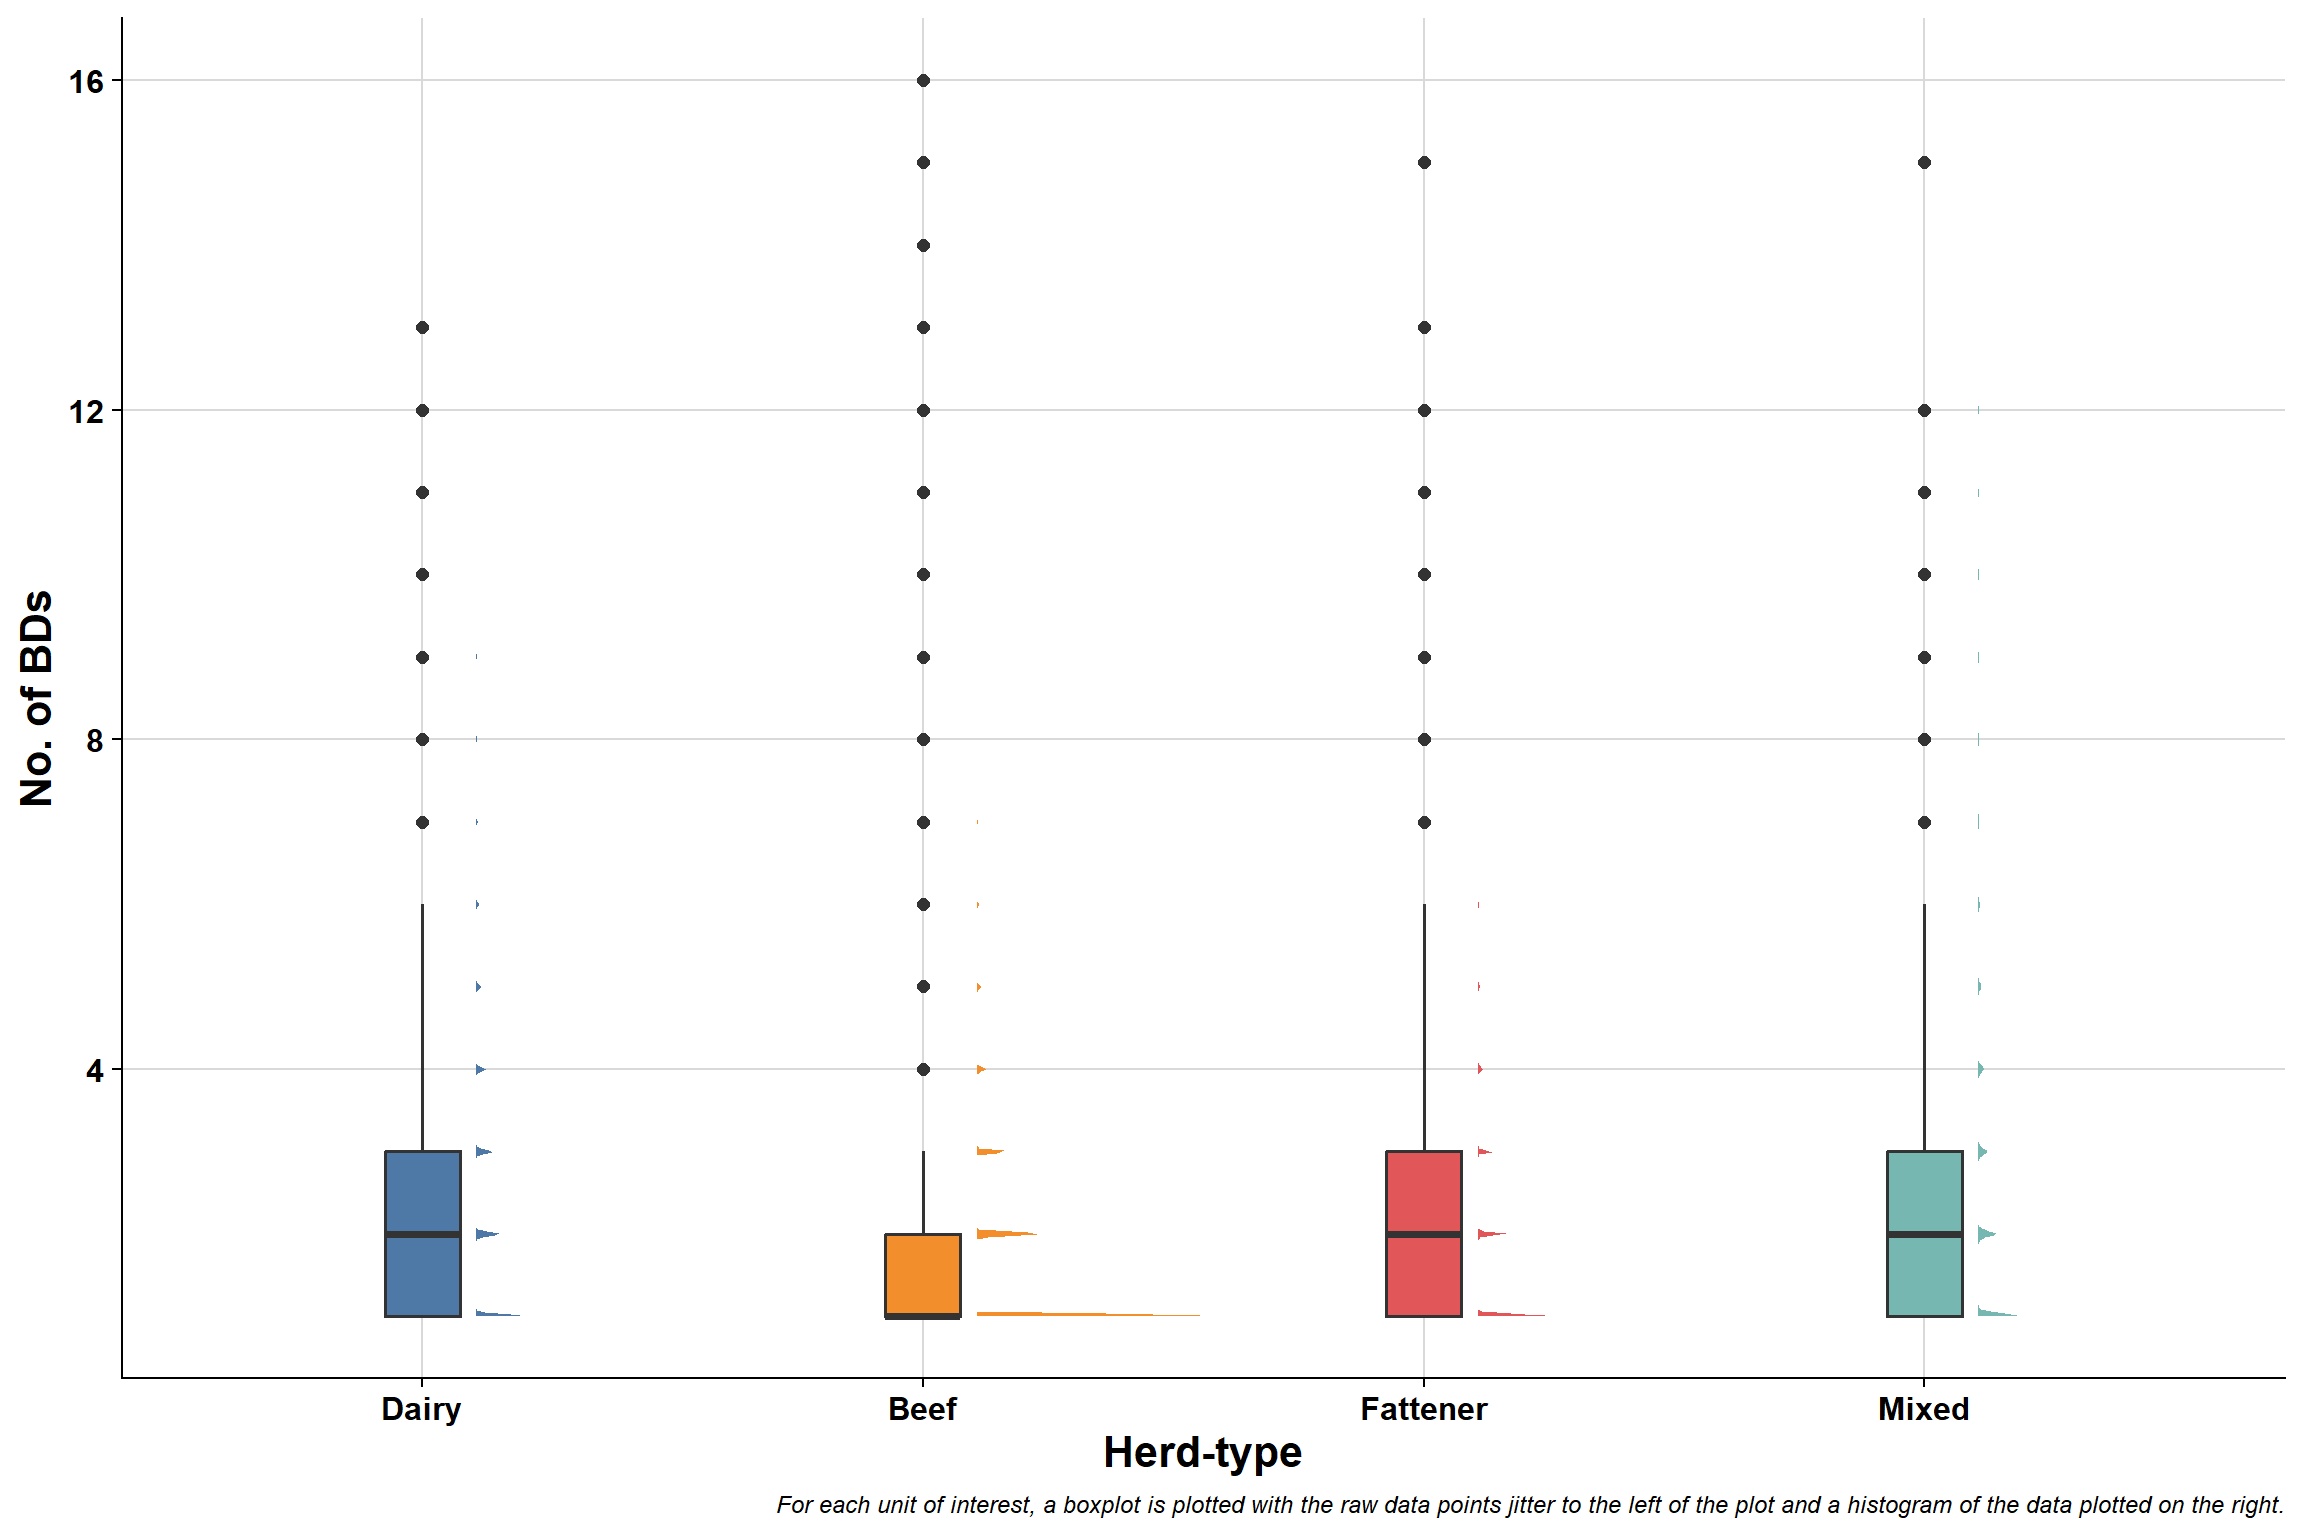
7.4.2 Brock et al. herd-type by BD size
\(~\)
\(~\)
\(~\)
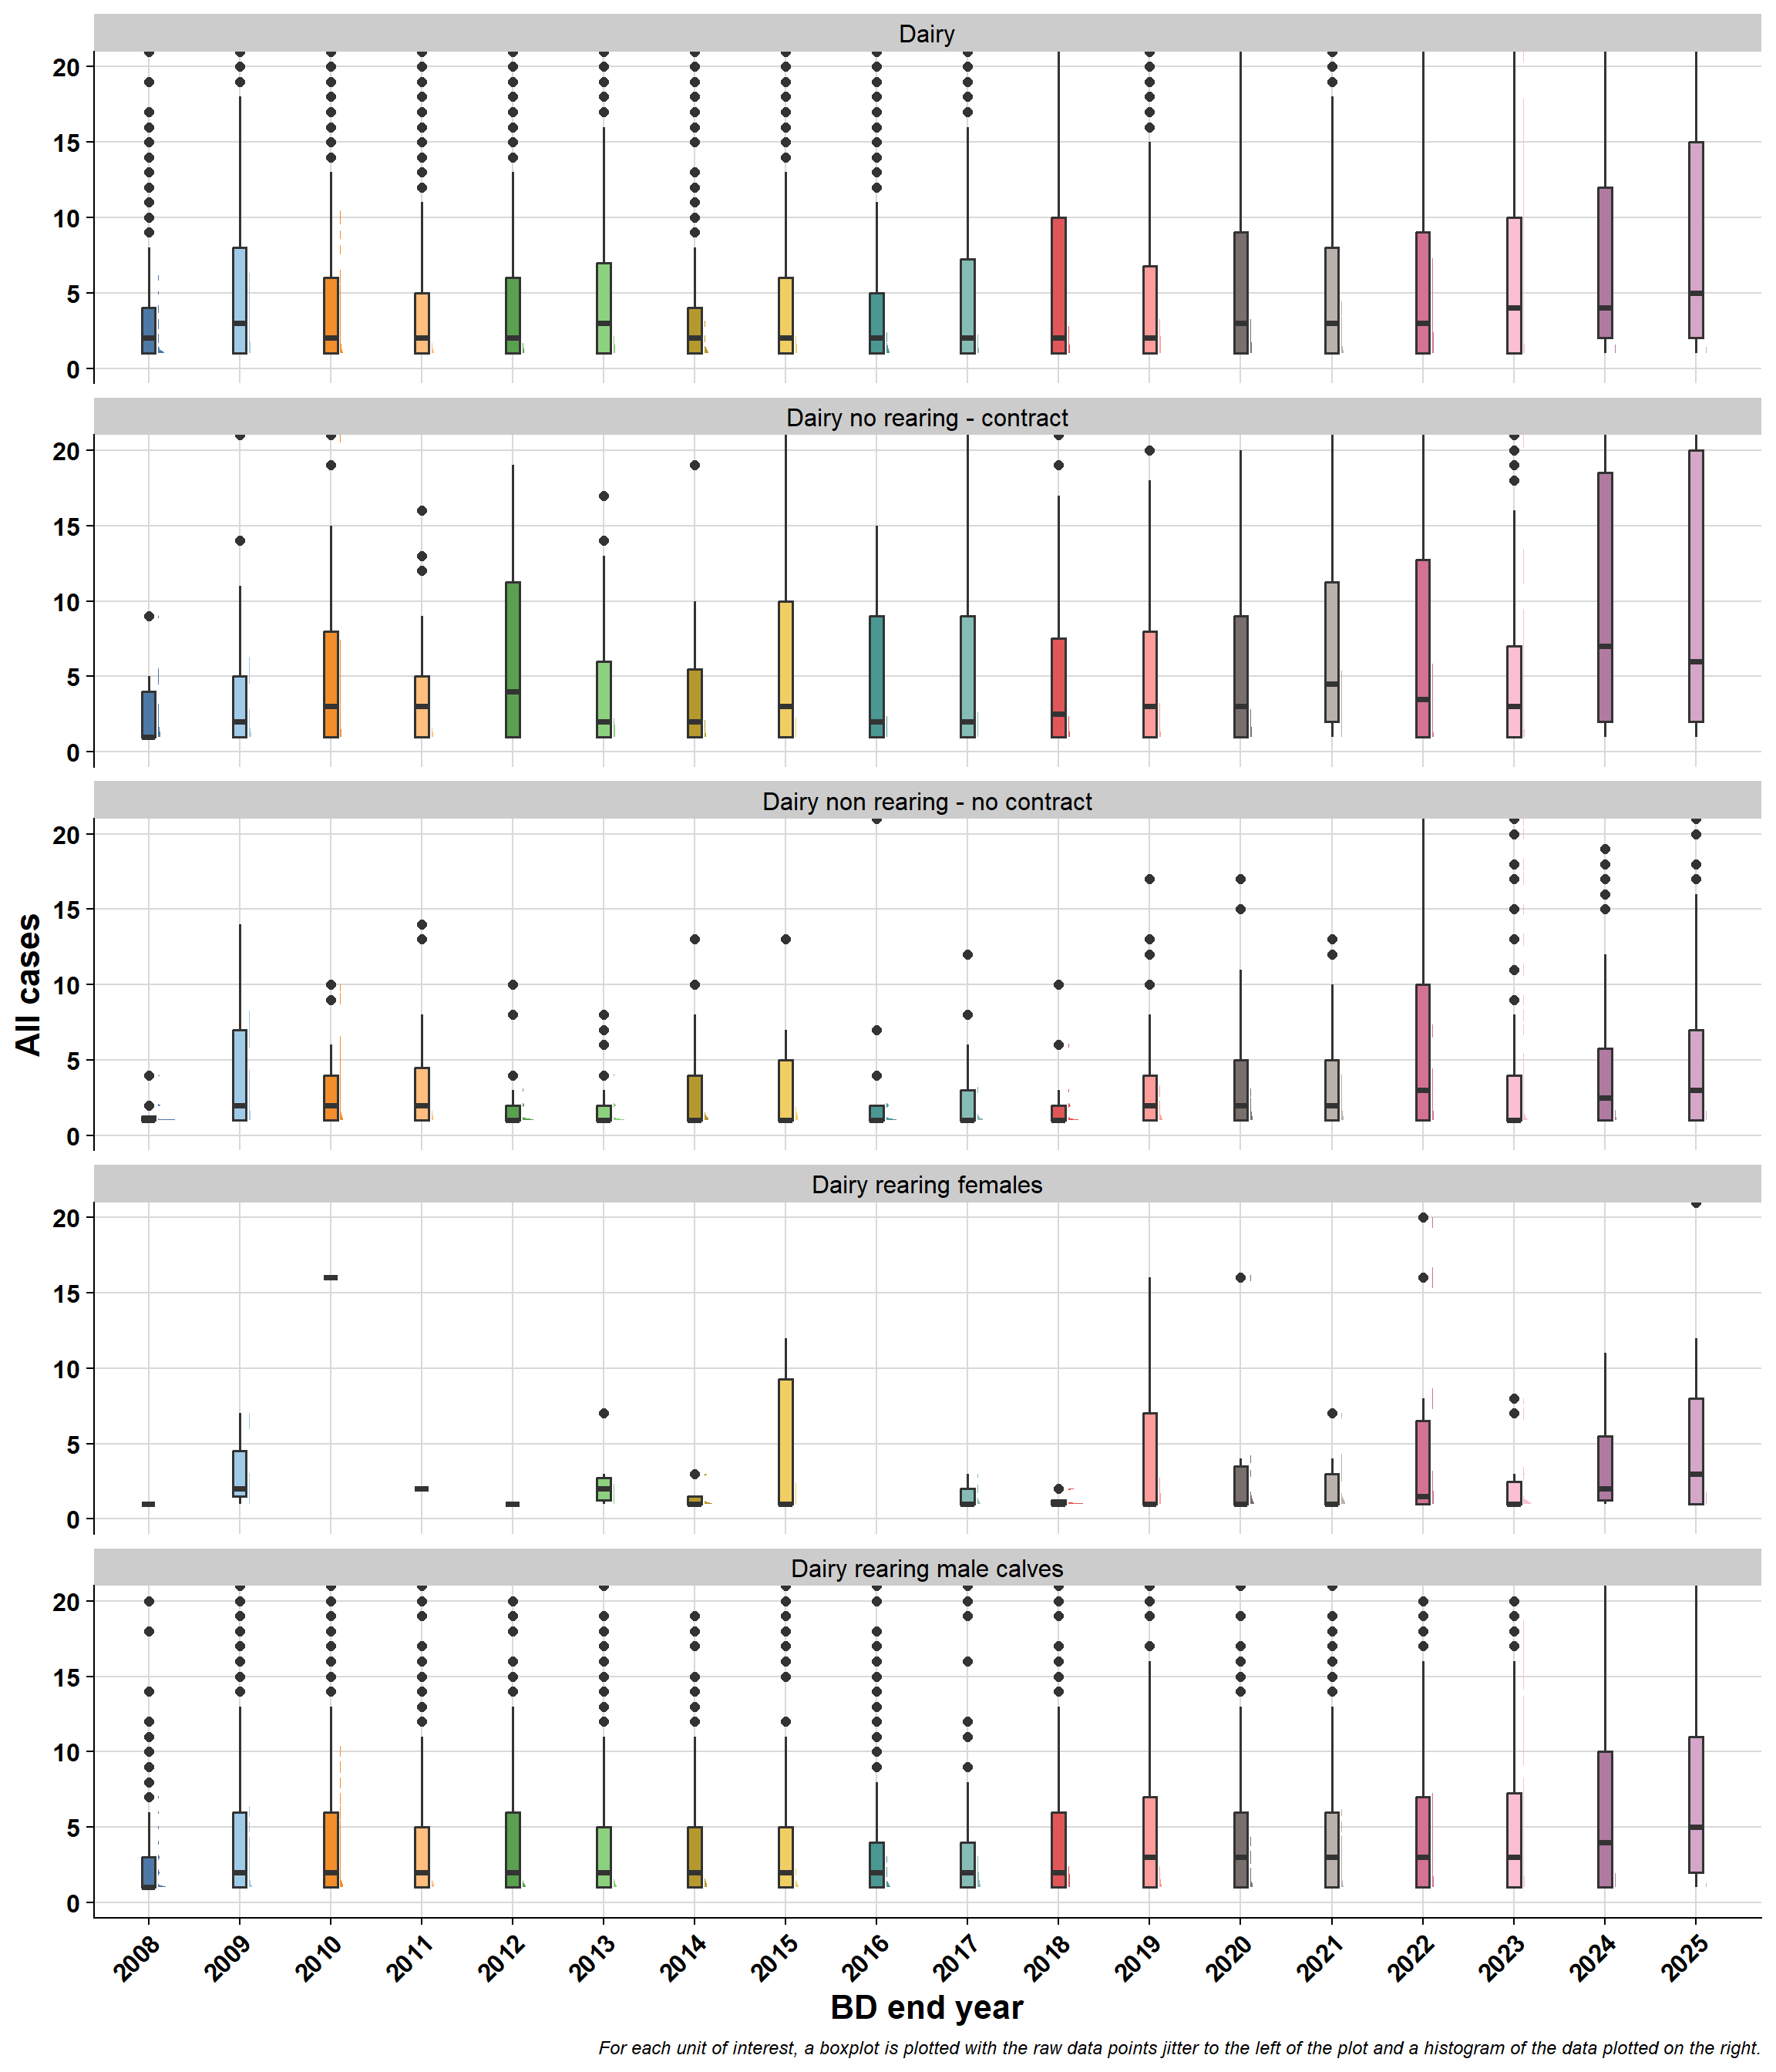
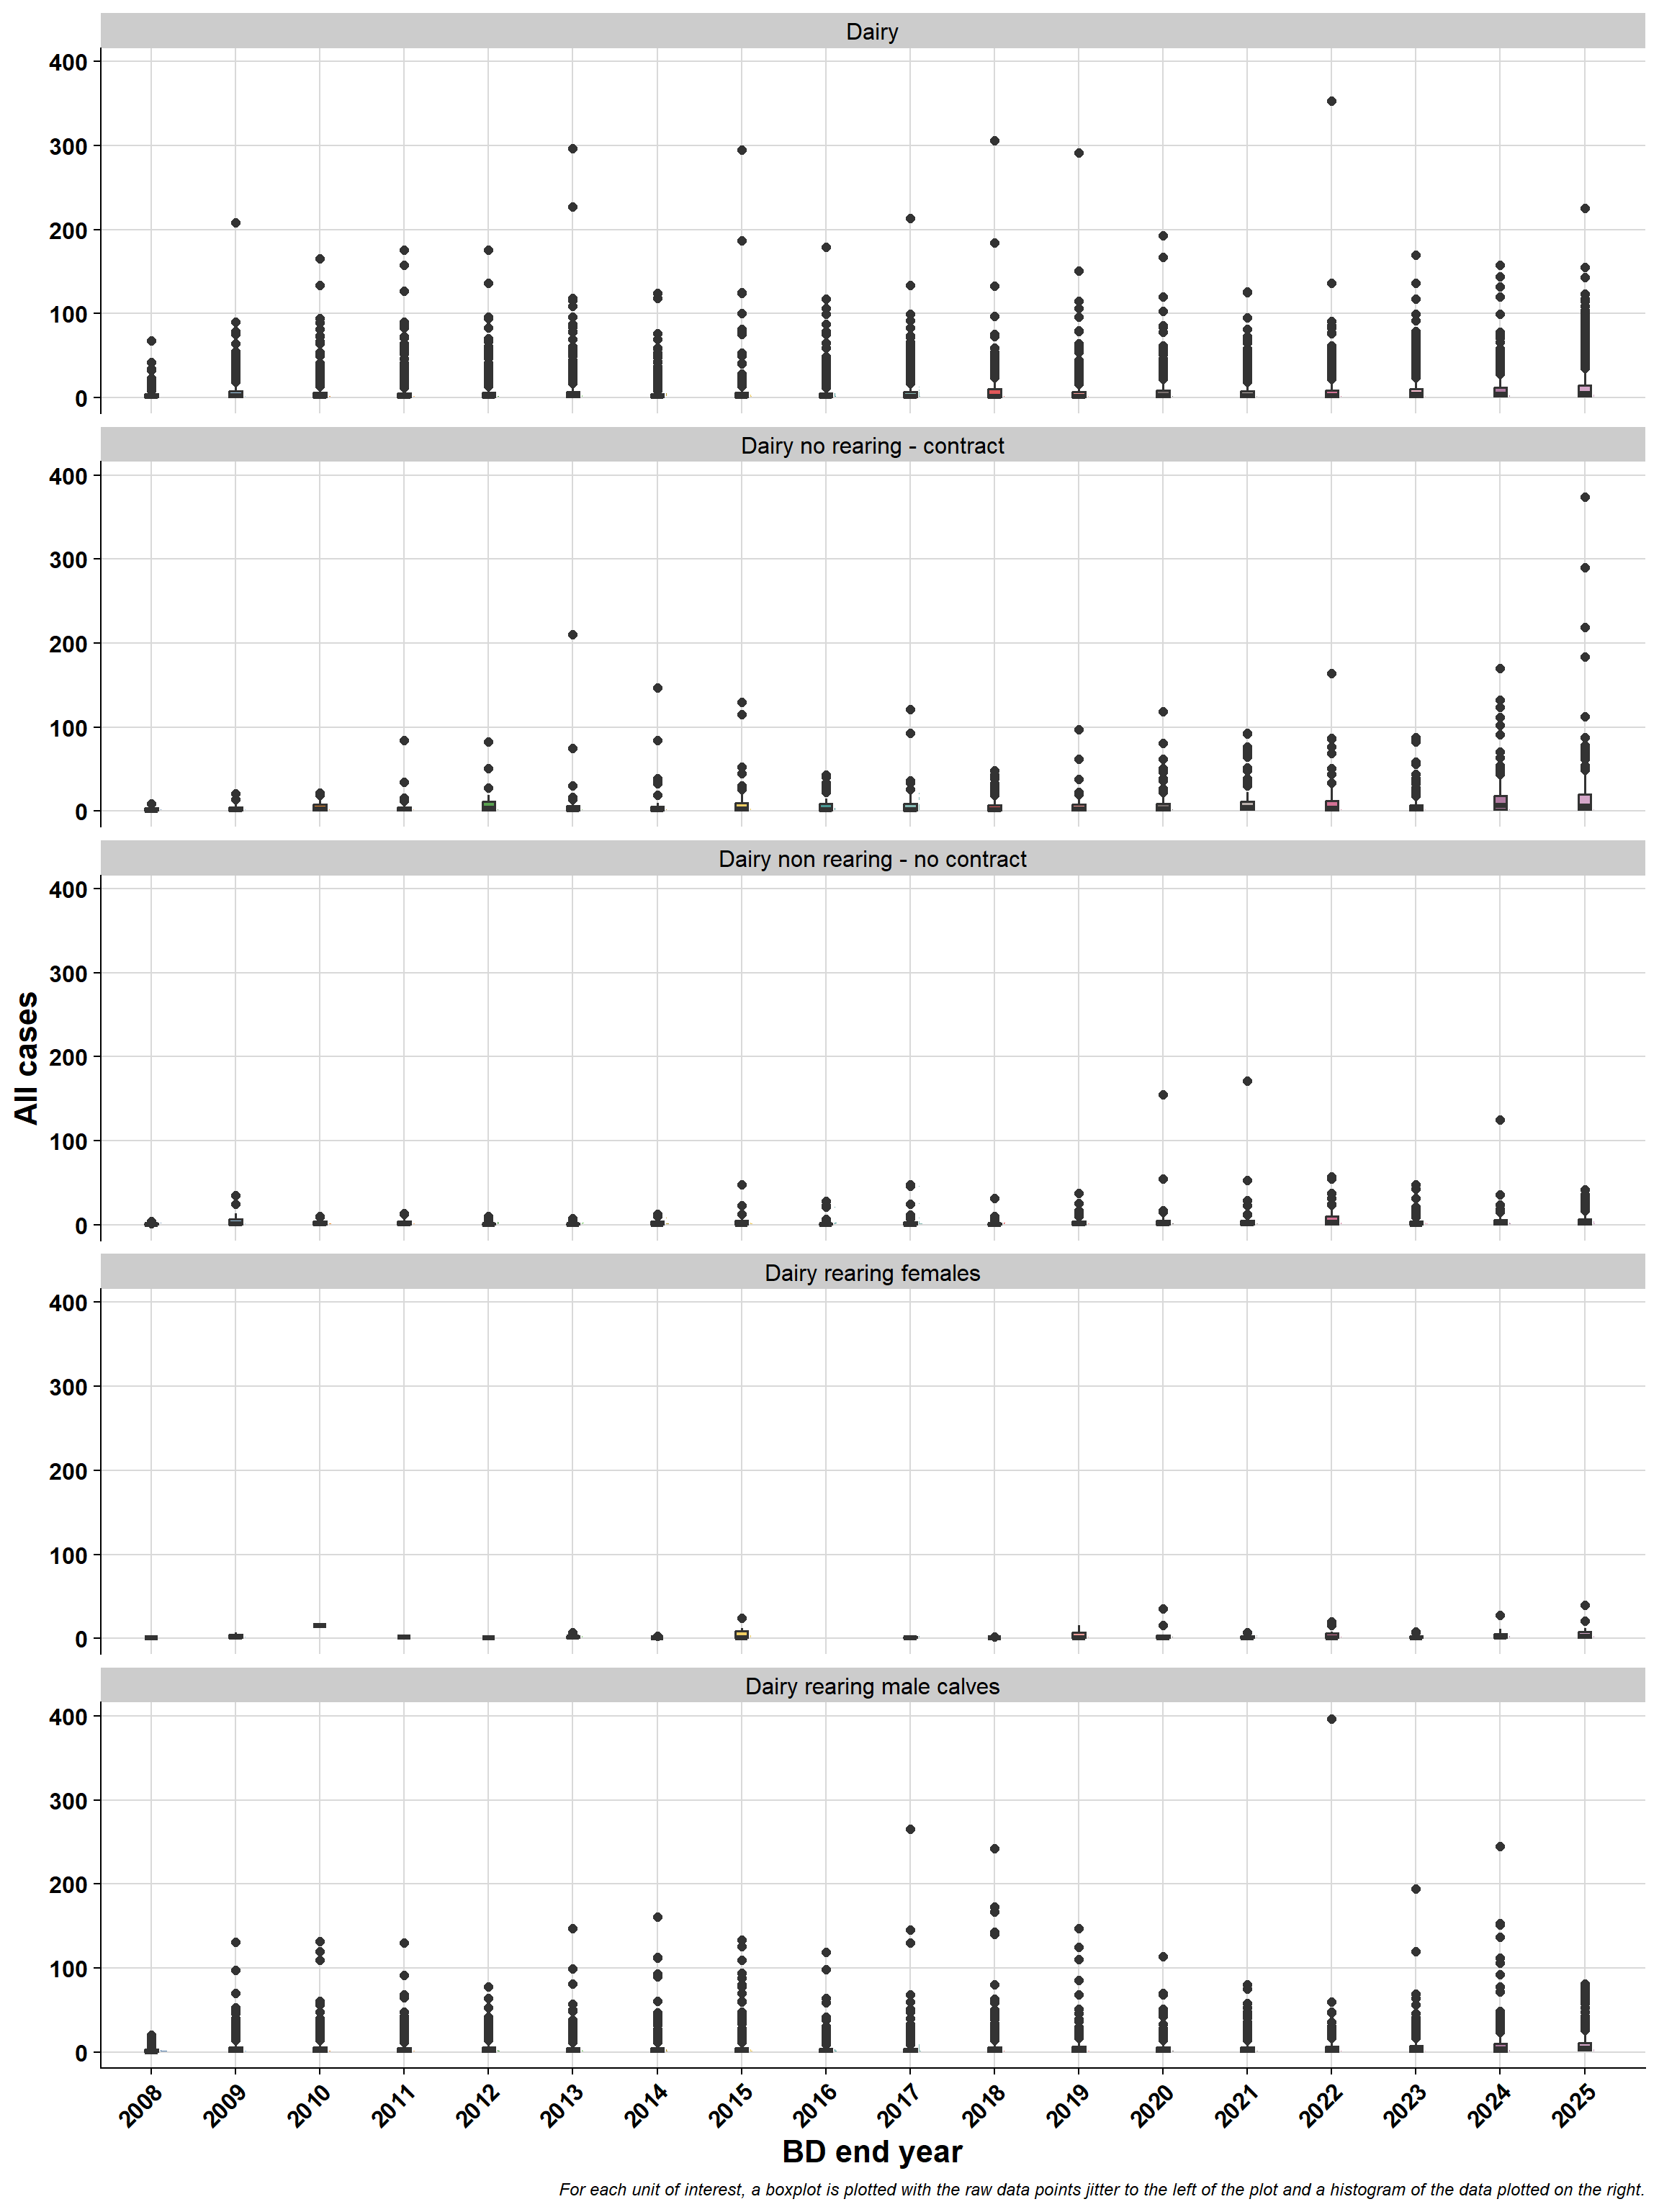
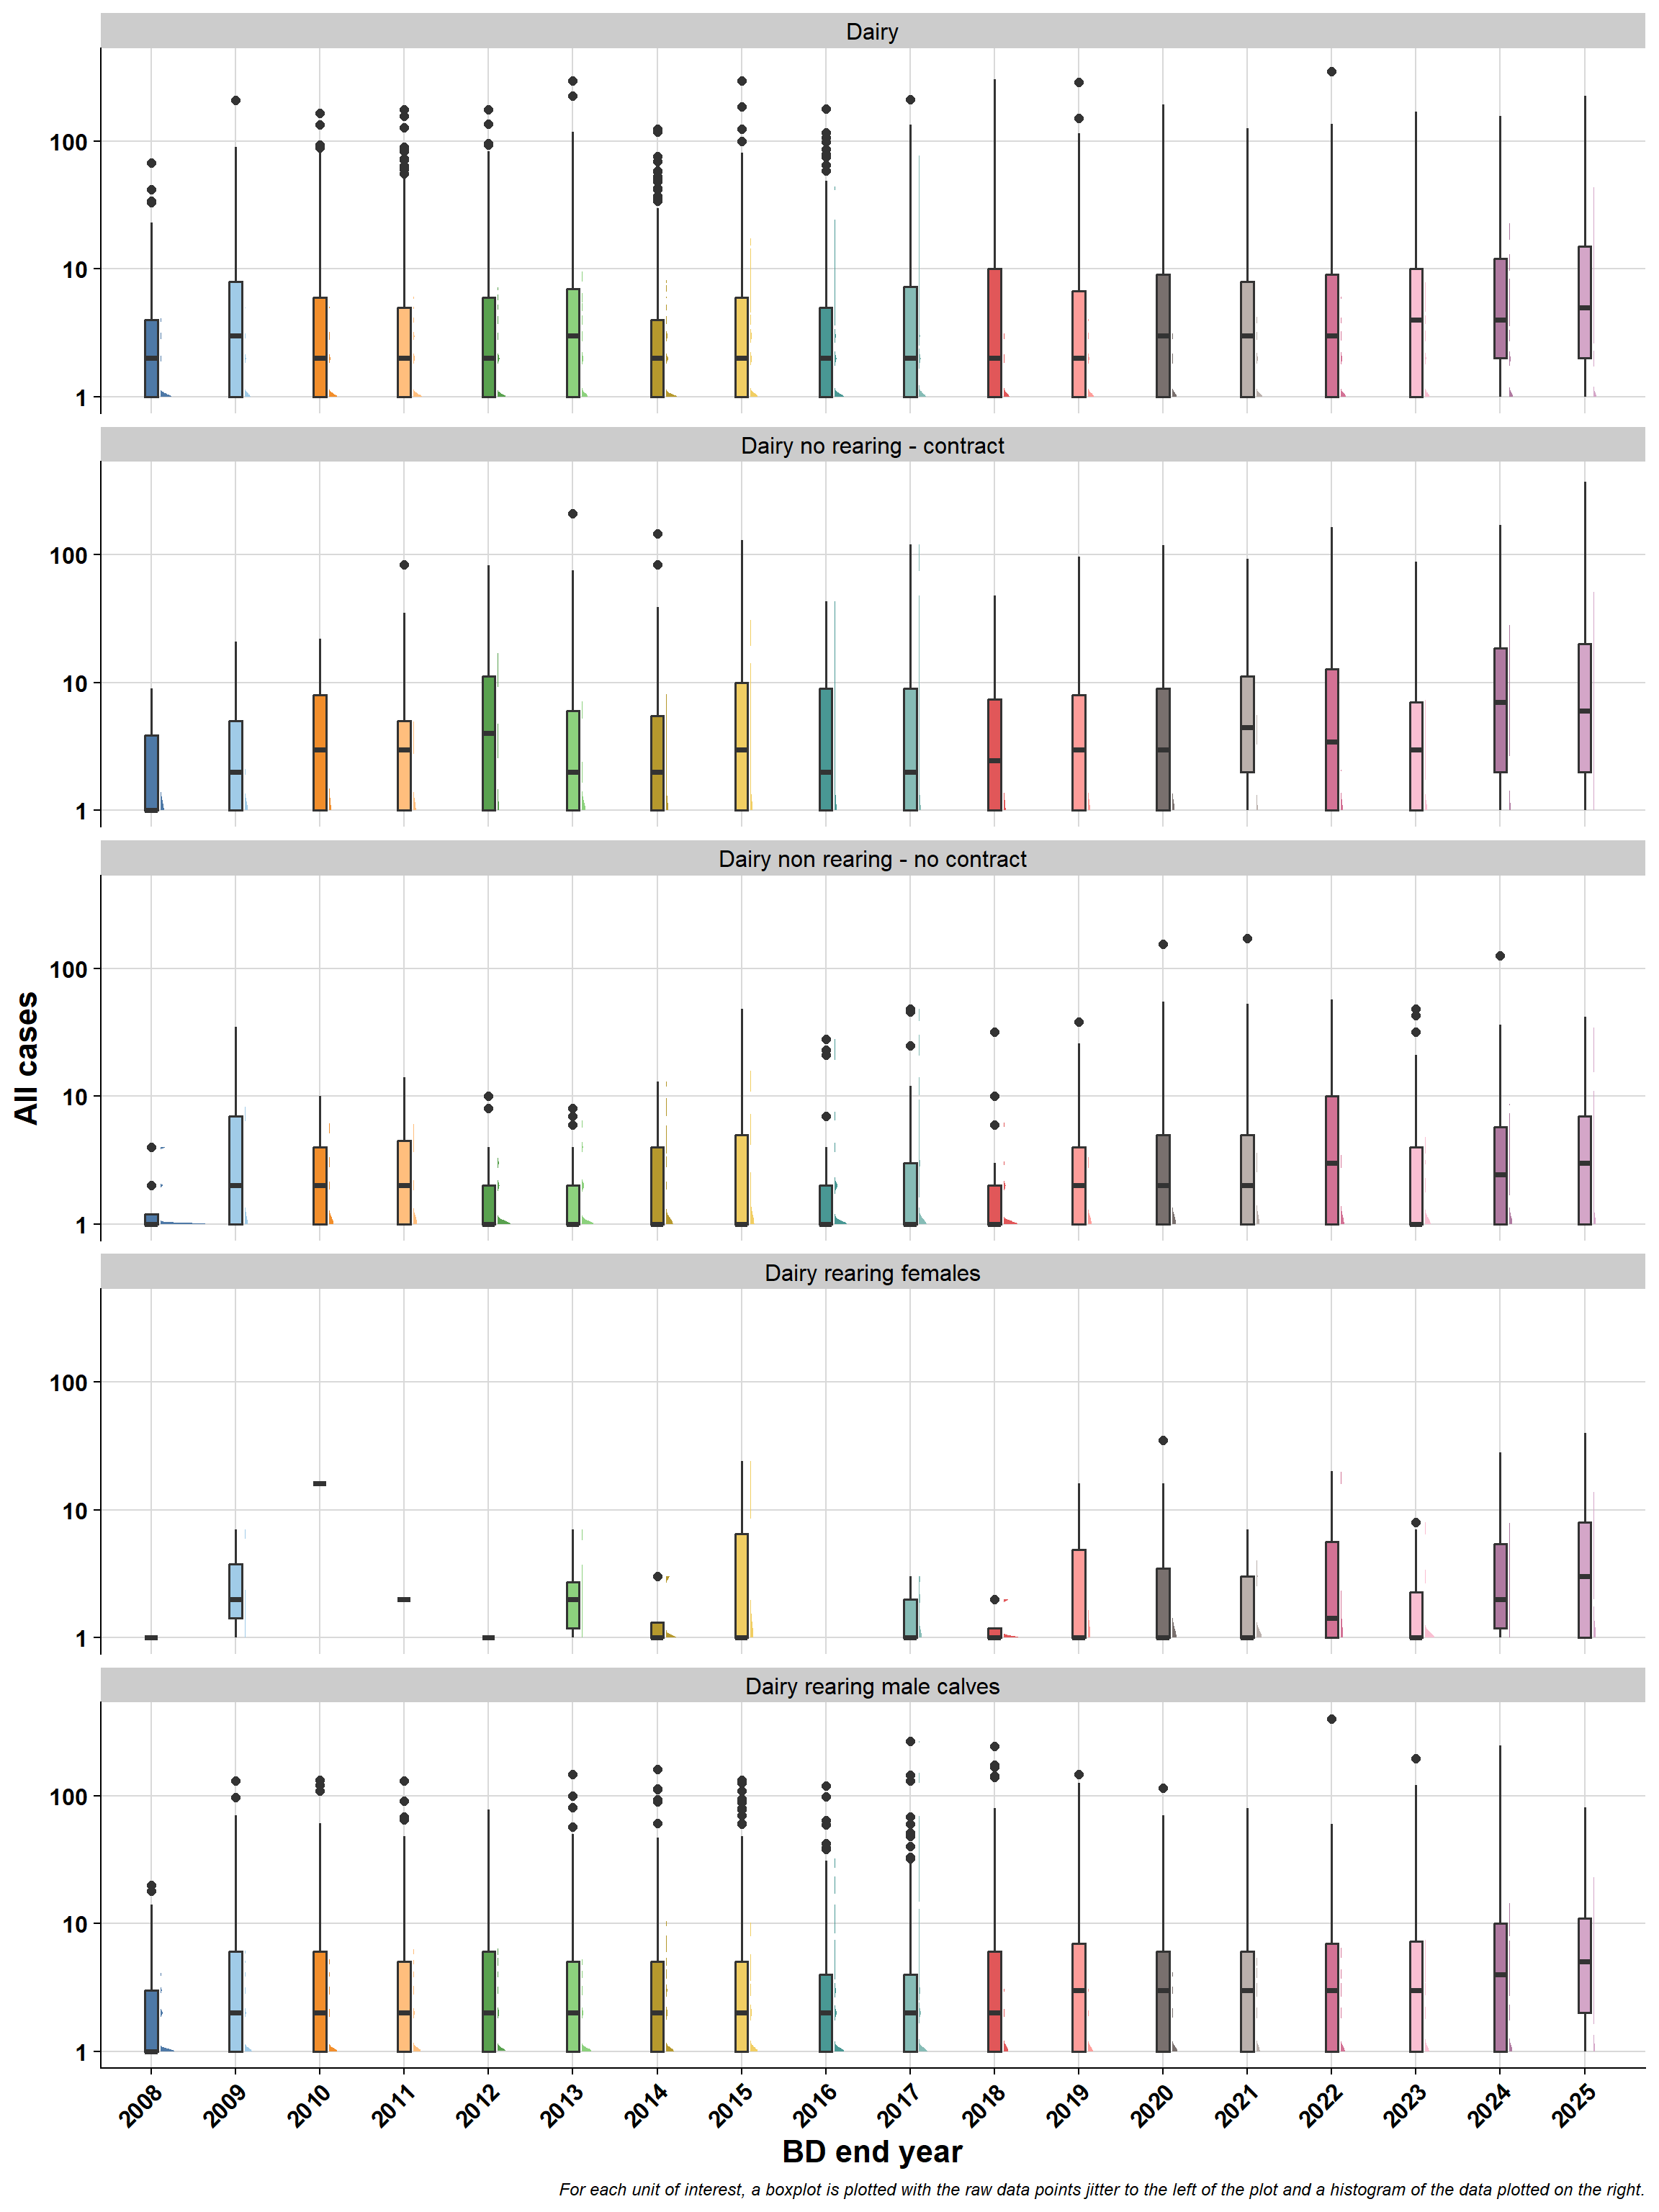
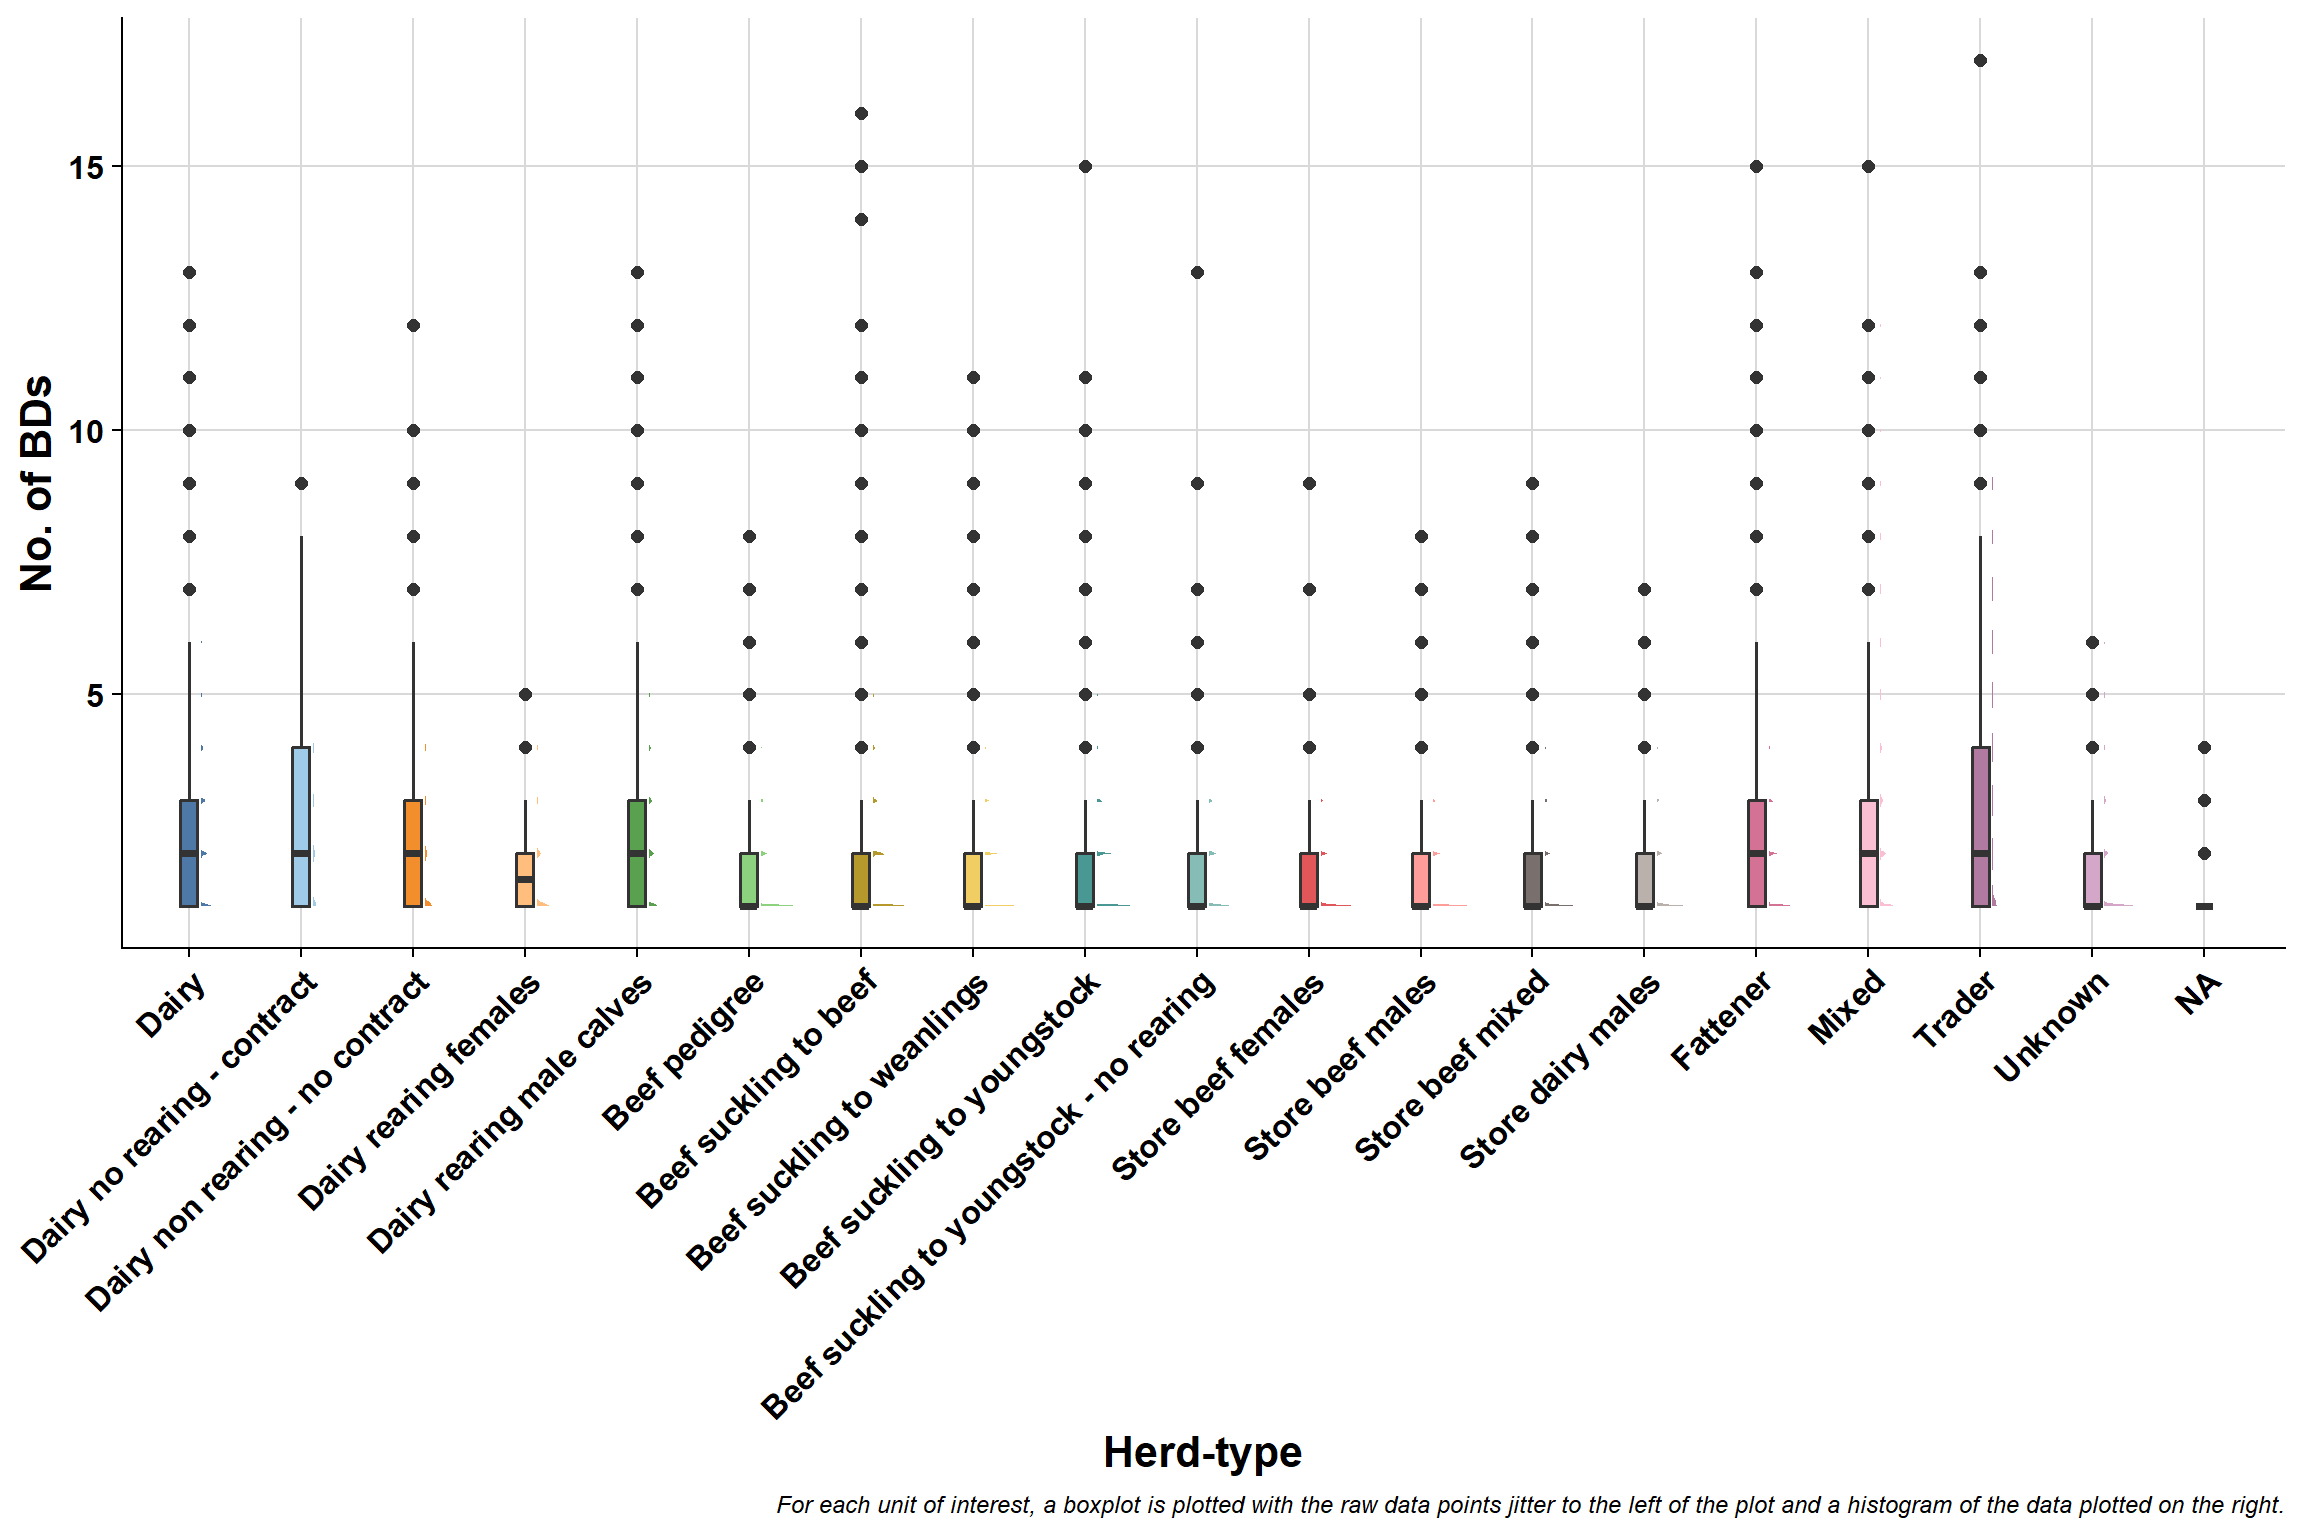
7.4.3 Brock et al. dairy sub-class herd-types by BD size
Rather than plotting all sub-classes, here we focus on dairy sub-classes only as we have seen above that dairy tend to have the largest BDs in terms of the number of bTB cases disclosed.
\(~\)
\(~\)
\(~\)
7.4.4 BD size by category groups
7.4.4.1 All herds combined
7.4.4.2 AHCS
7.4.4.3 Brock et al.
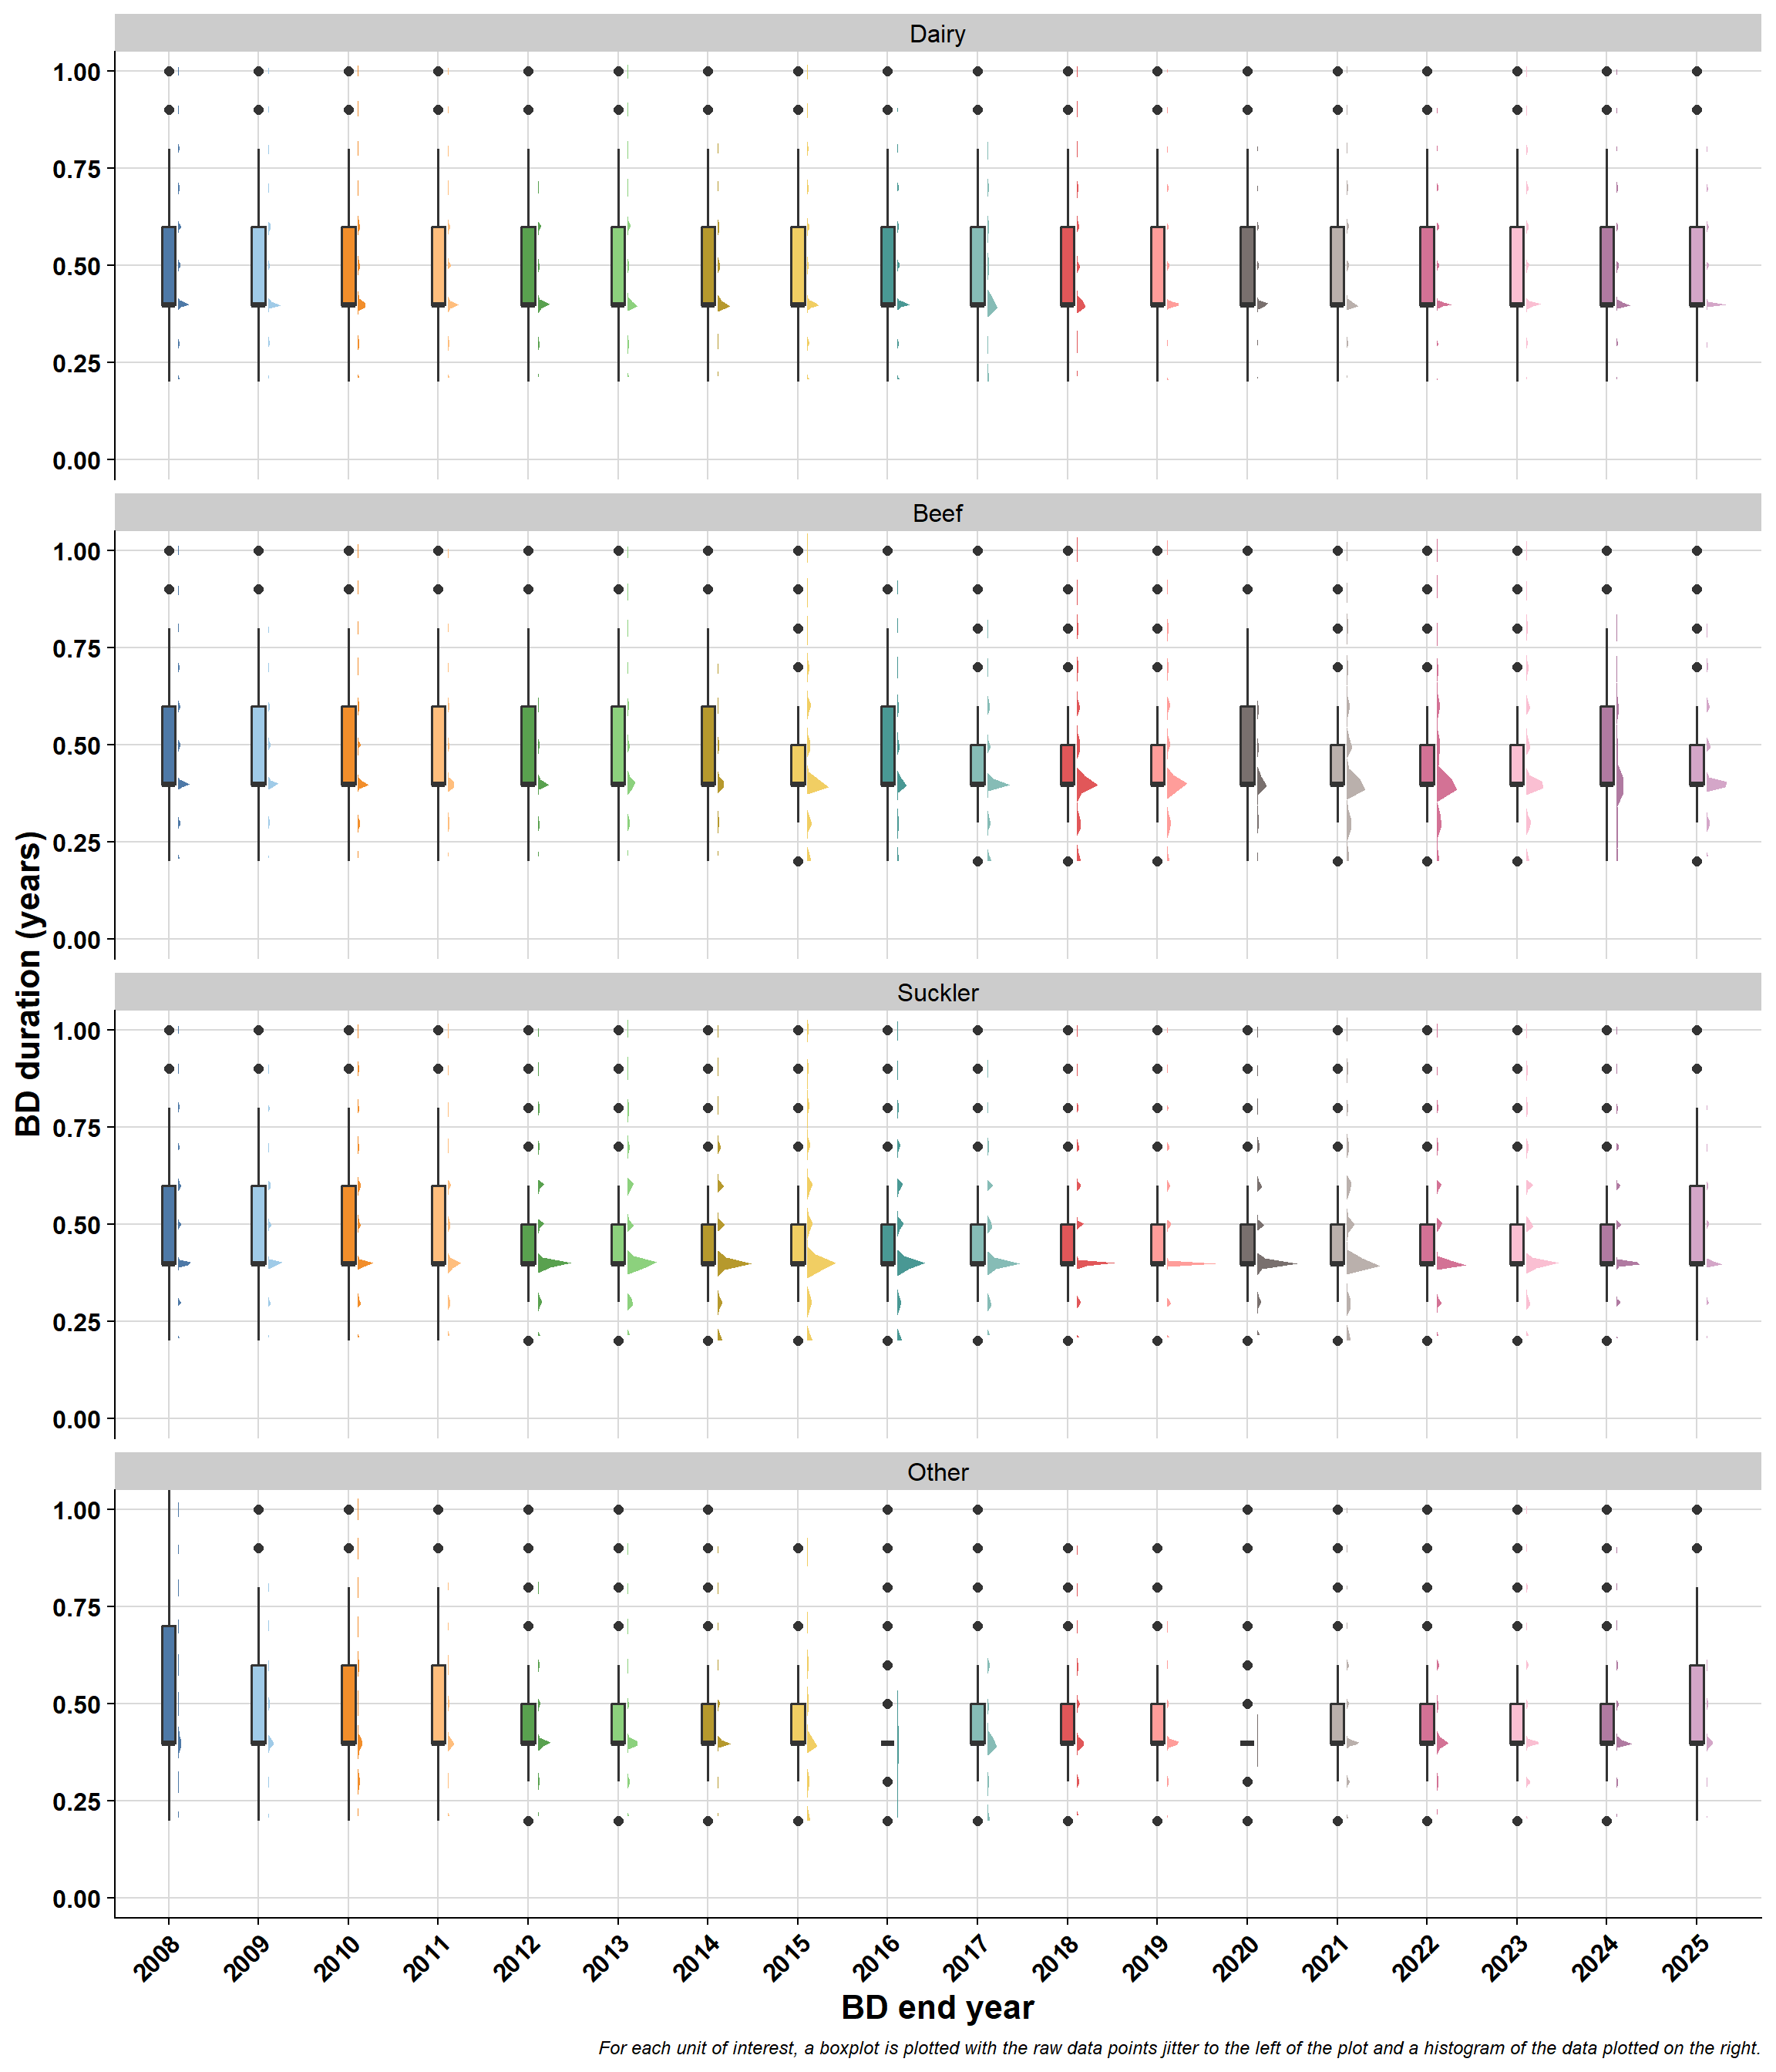
7.5 BD duration
\(~\)
7.6 Repeat BD herds
Some herds will have more than one BD over time (i.e., they have a BD, become clear, and then have another BD). This is the proportion of herds with different number of BDs:
 bd_no     n       percent
     1 23940 0.49076484697
     2 12704 0.26042926549
     3  6114 0.12533568398
     4  2939 0.06024886739
     5  1482 0.03038068100
     6   792 0.01623582952
     7   383 0.00785141756
     8   203 0.00416145630
     9   108 0.00221397675
    10    56 0.00114798795
    11    23 0.00047149505
    12    17 0.00034849634
    13    11 0.00022549763
    14     1 0.00002049978
    15     6 0.00012299871
    16     1 0.00002049978
    17     1 0.00002049978
7.6.1 Boxplots of the number of BDs per herd:
7.6.1.1 AHCS:
7.6.1.2 Brock et al.:
7.6.1.3 Brock et al. sub-classes:
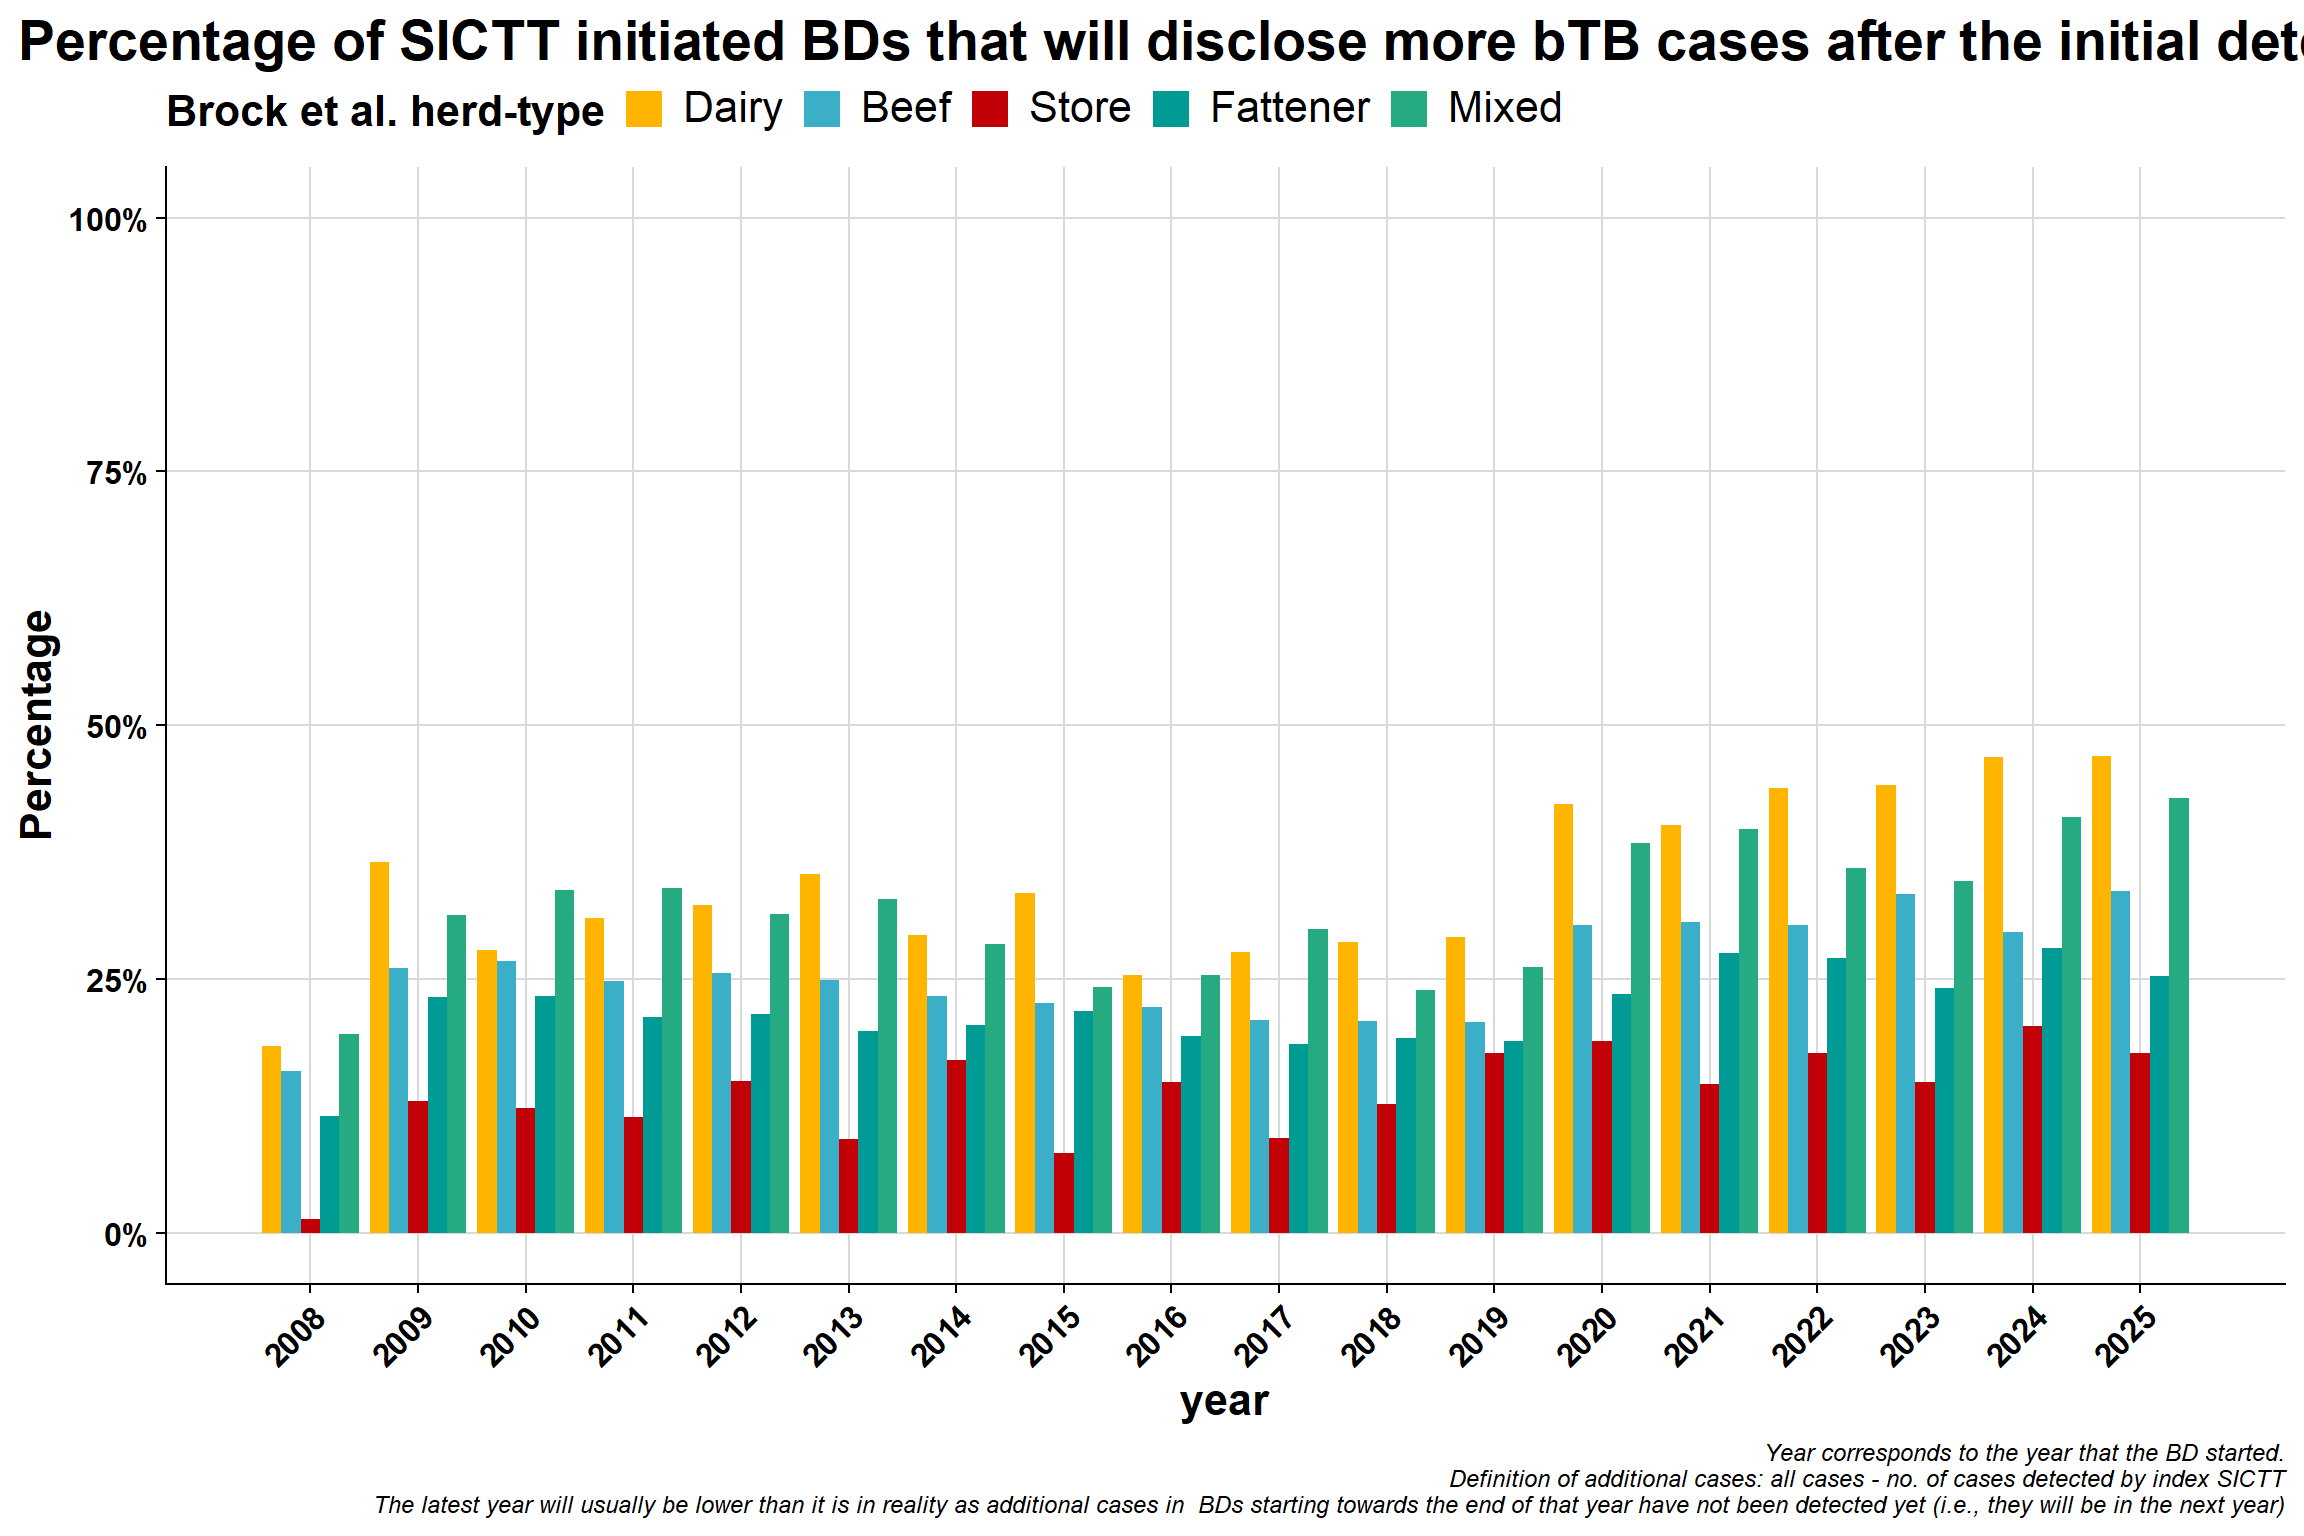
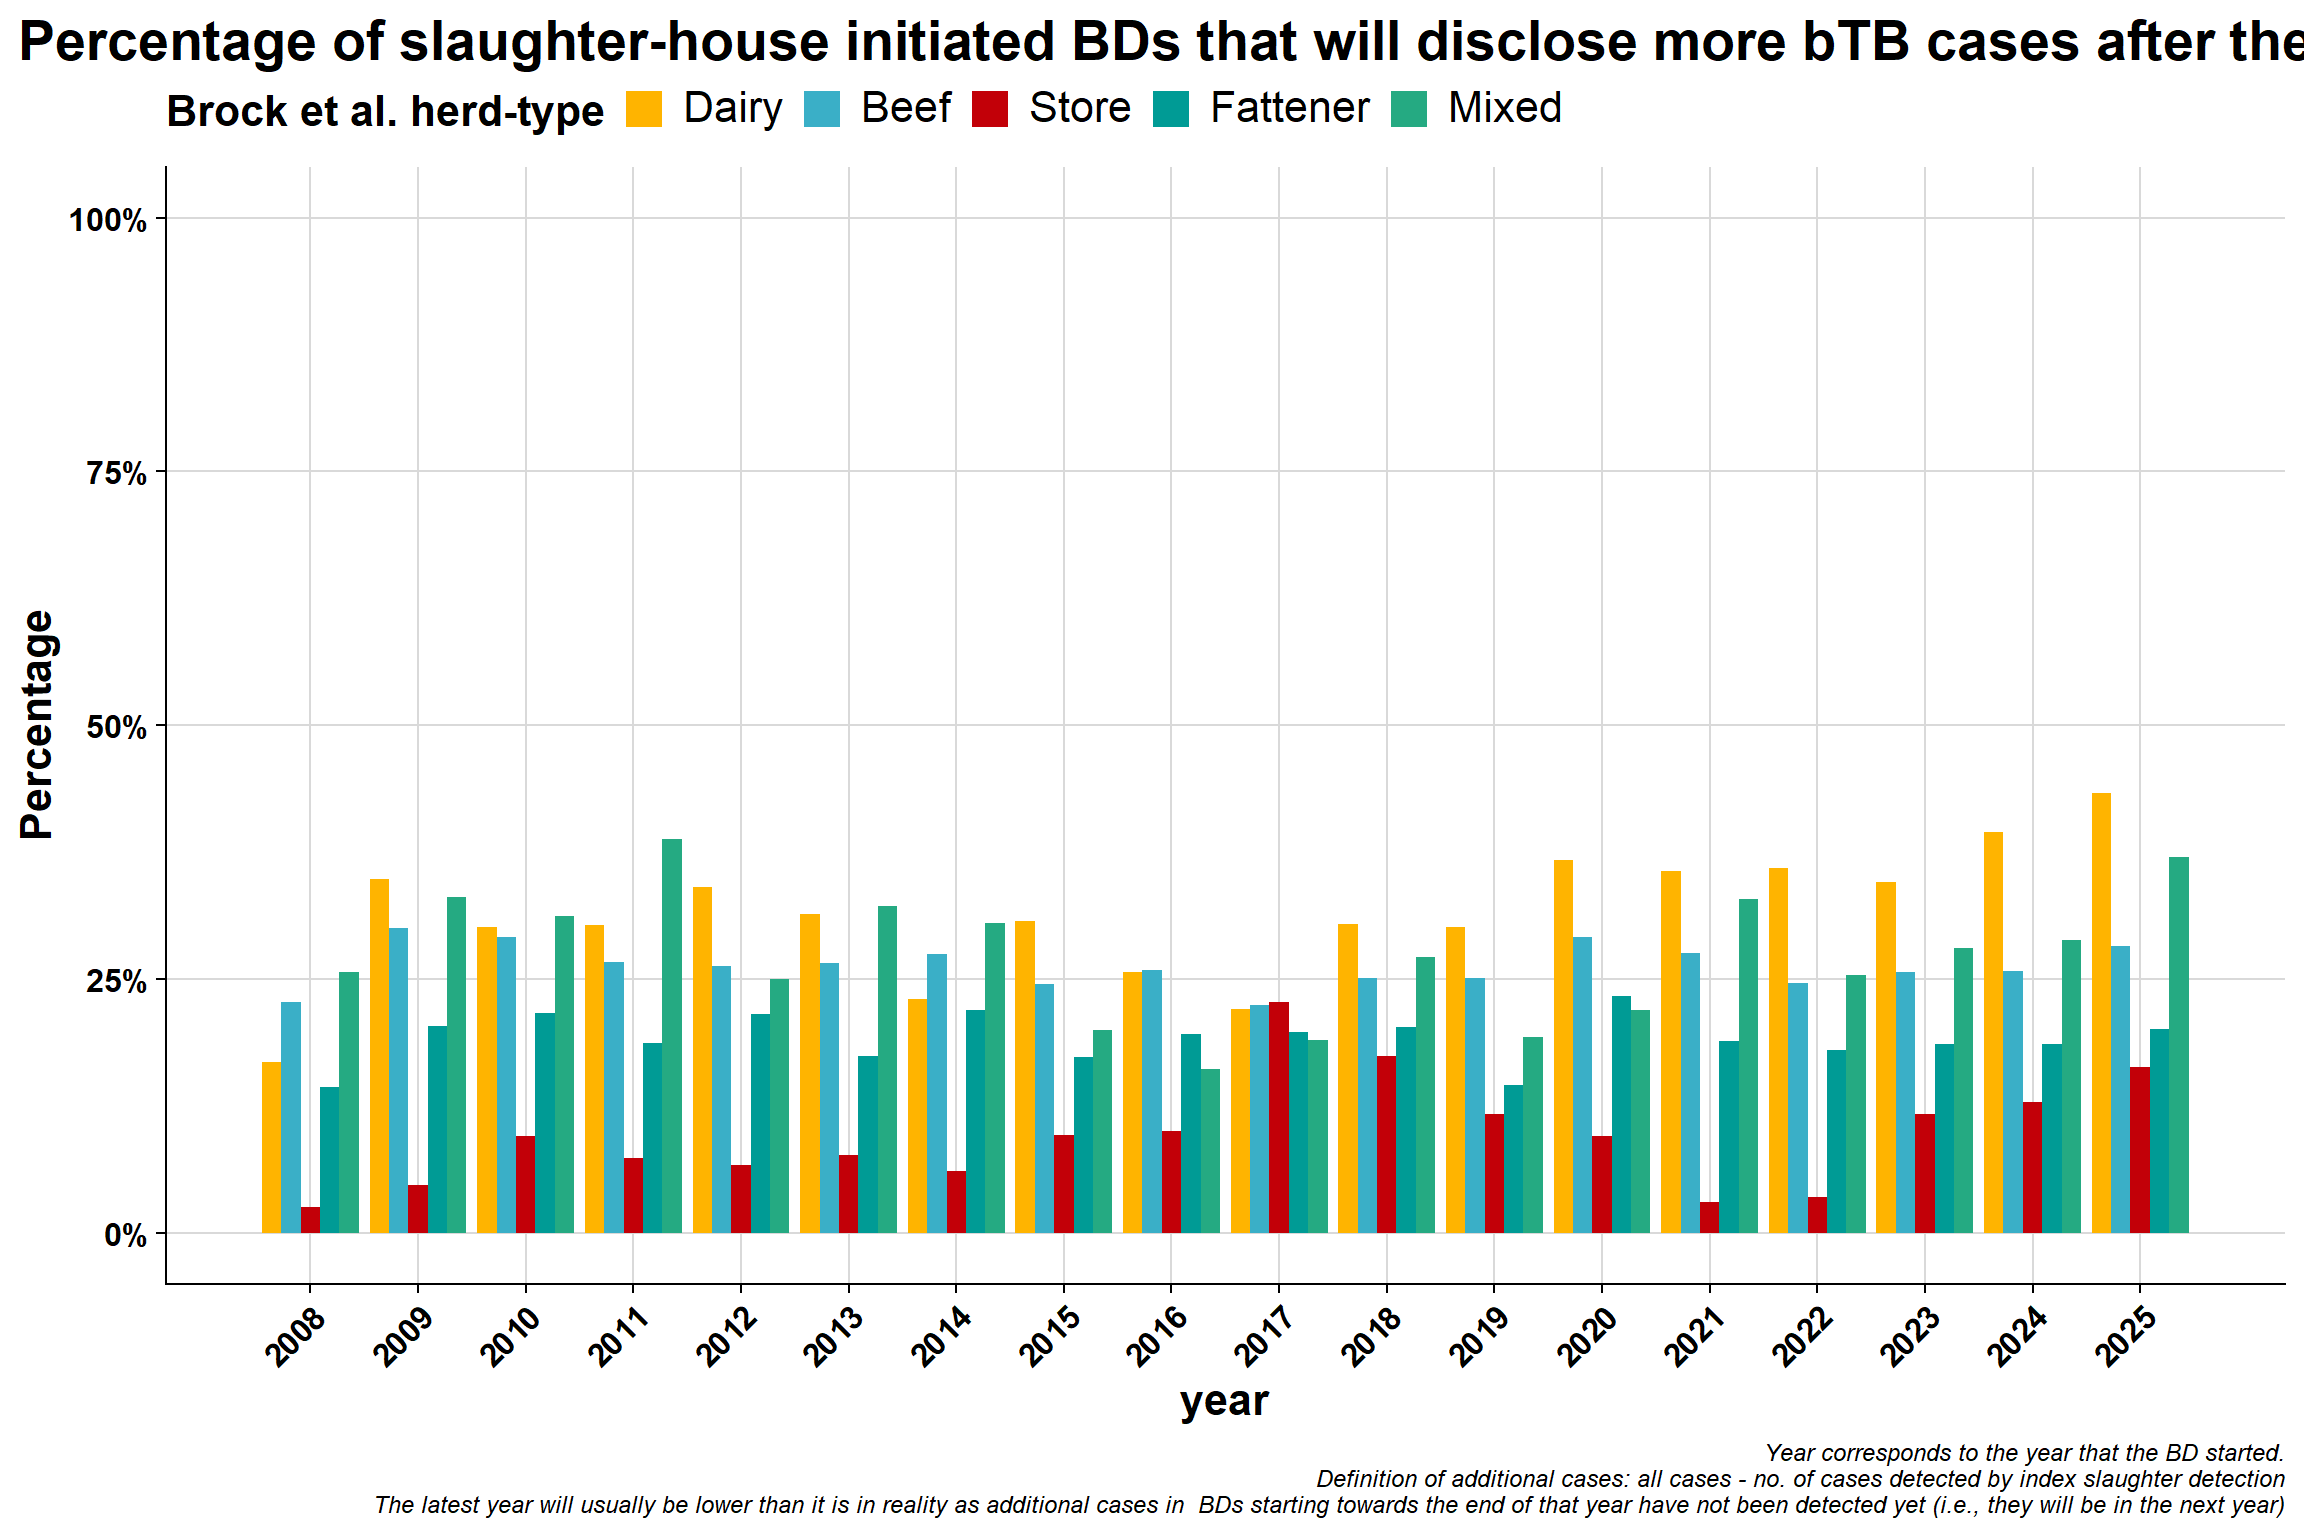
7.7 Additional bTB cases after the initial detection
7.7.1 SICTT initiated BDs
7.7.2 Slaughter-house initiated BDs
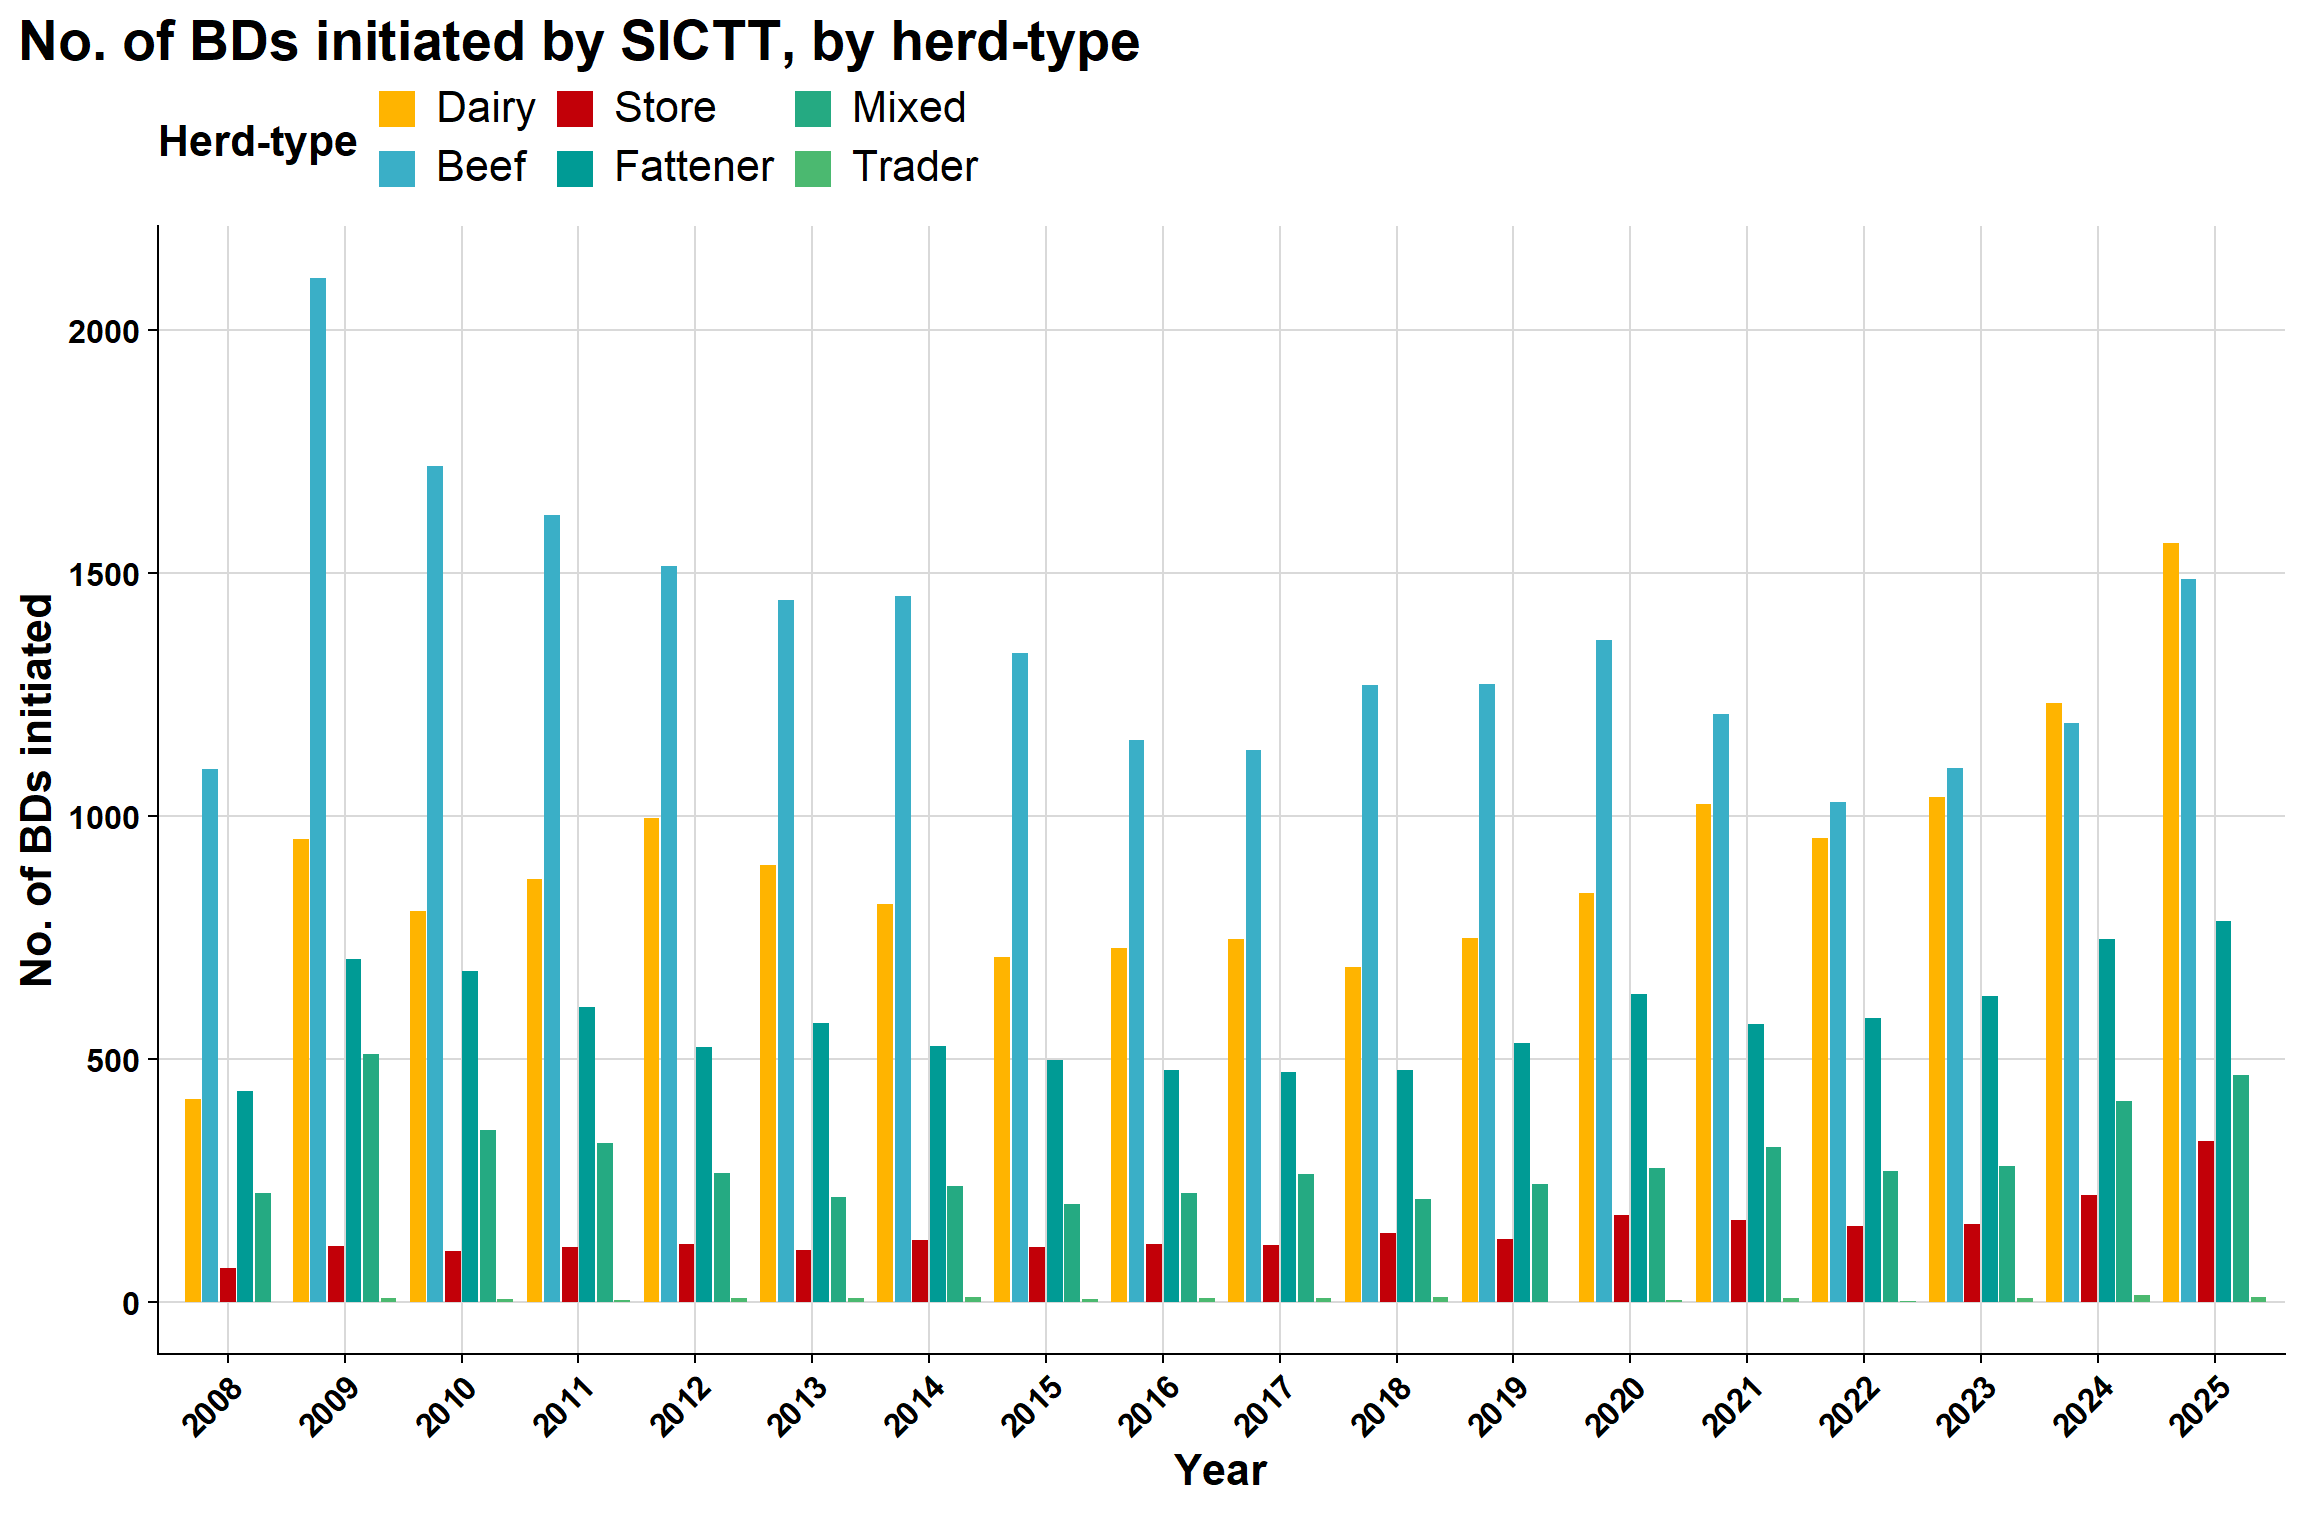
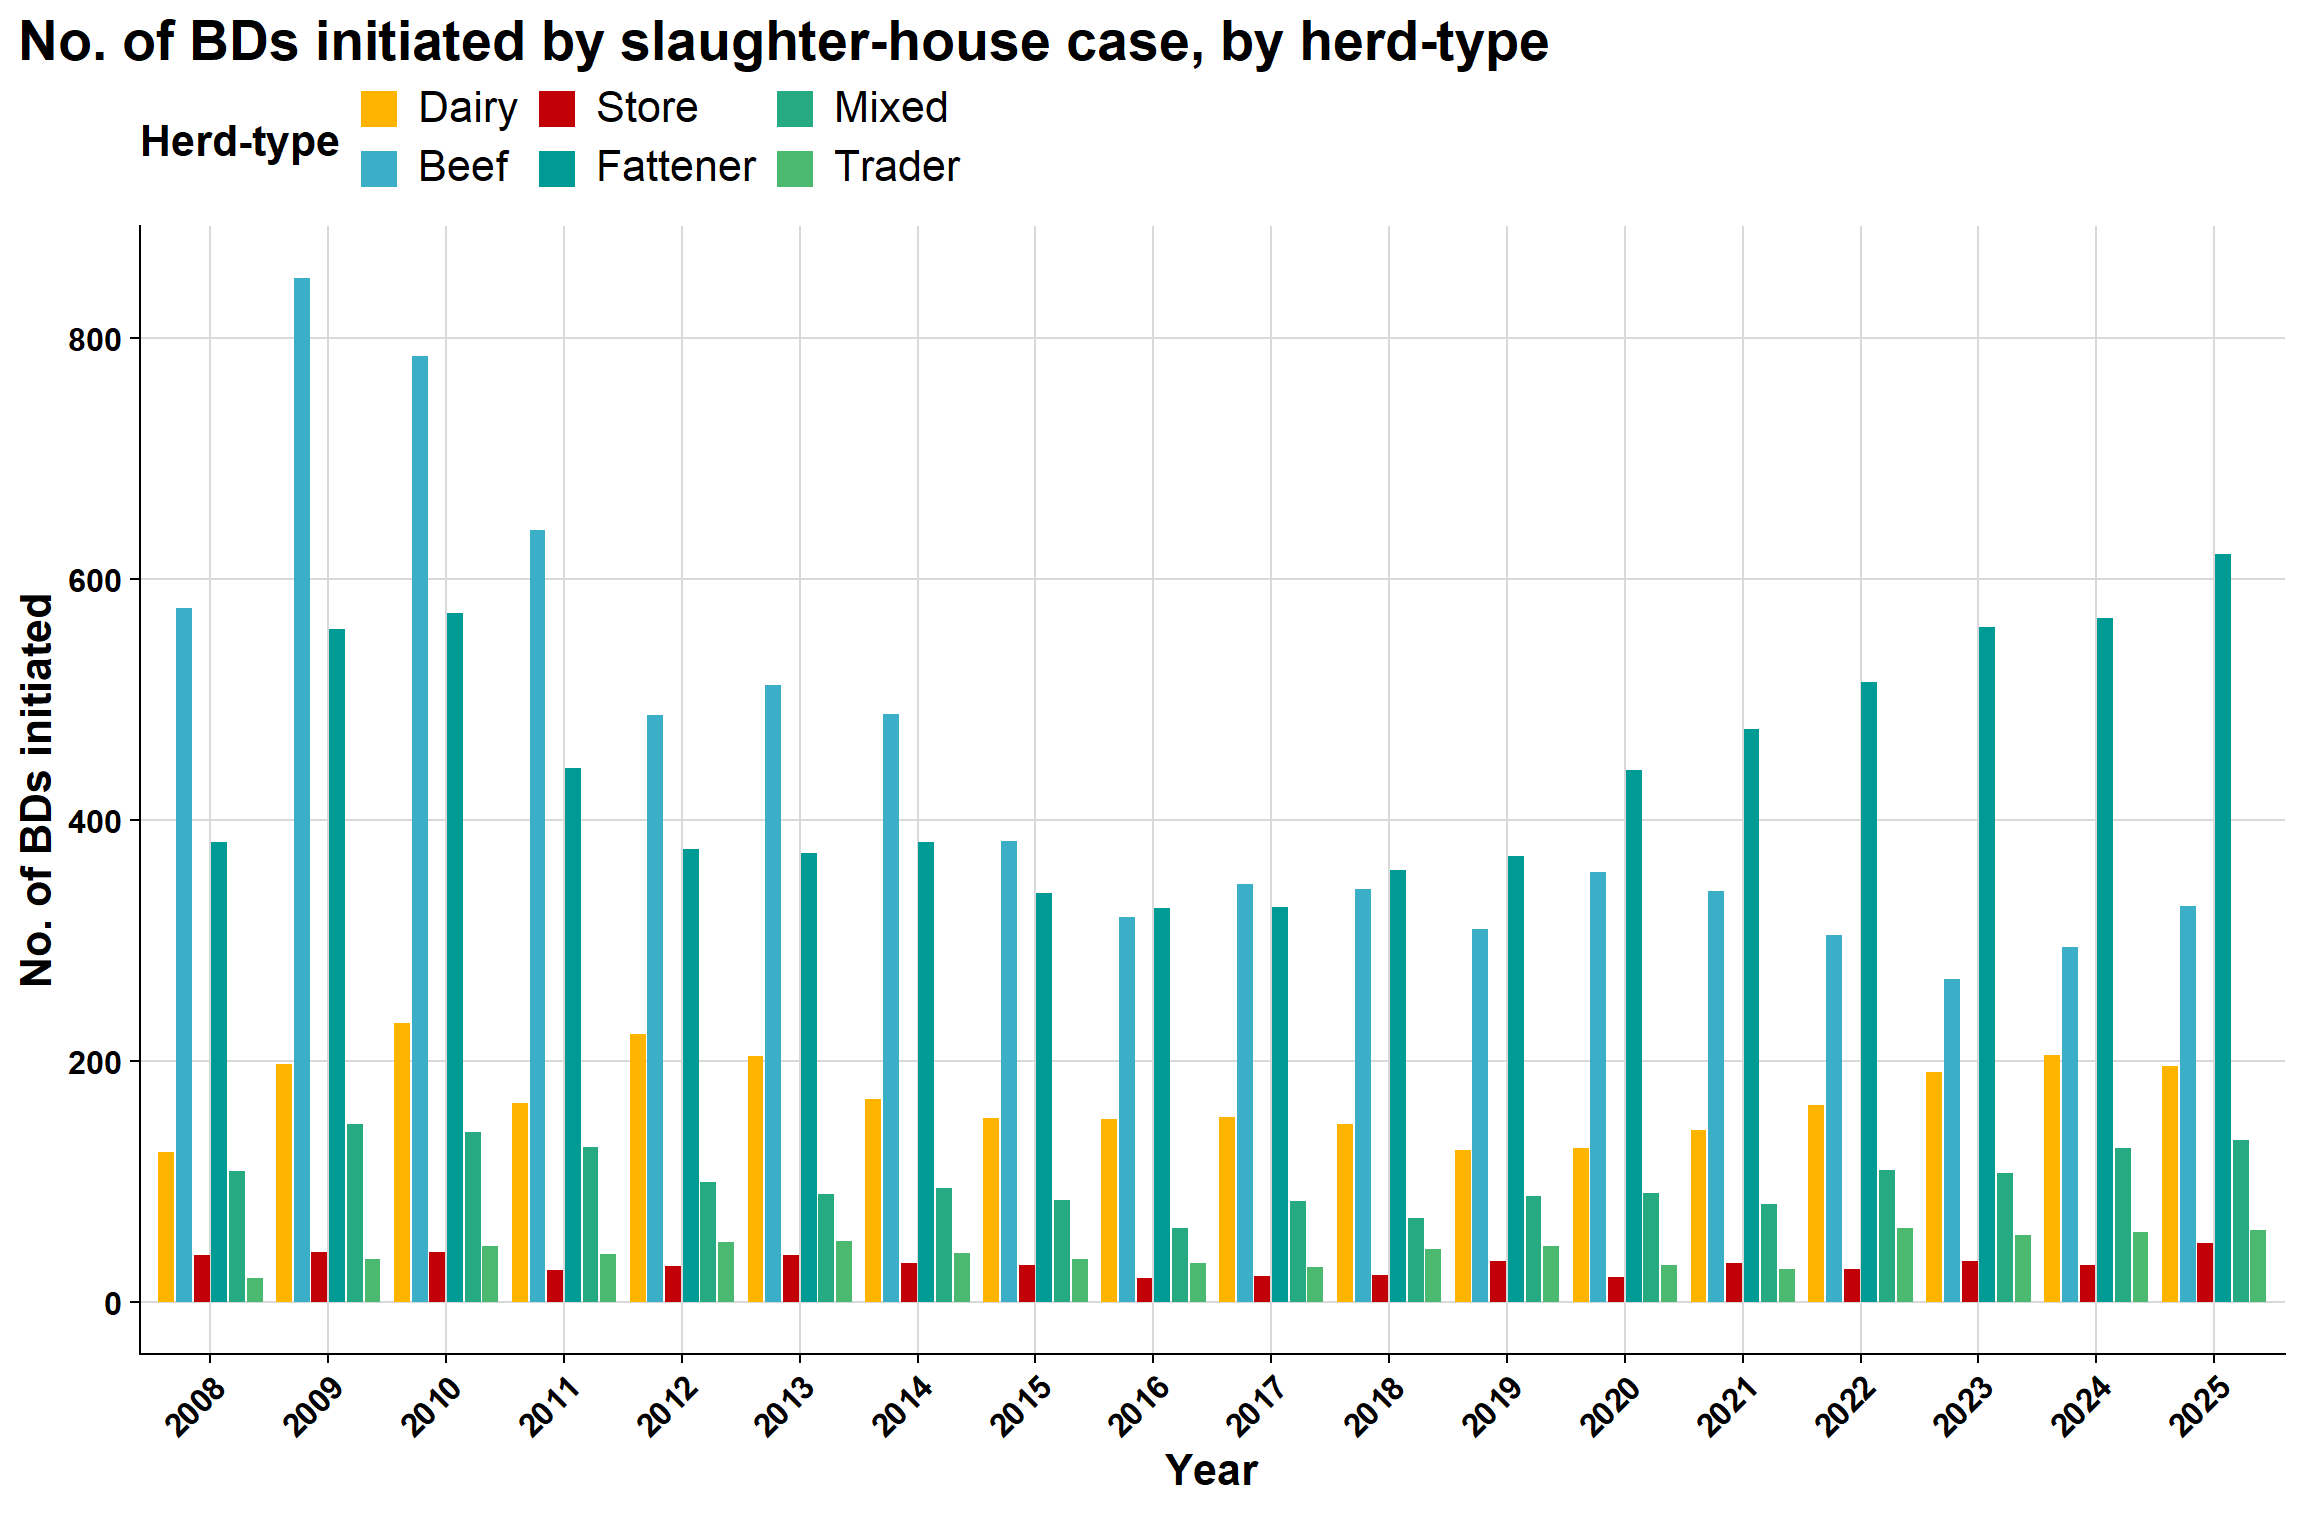
7.8 Count of no. BDs by detection method
7.8.1 SICTT initiated BDs
7.8.2 Slaughter-house initiated BDs
7.9 Tables
7.9.1 Overall BD statistics
Variable | level | 2008 | 2009 | 2010 | 2011 | 2012 | 2013 | 2014 | 2015 | 2016 | 2017 | 2018 | 2019 | 2020 | 2021 | 2022 | 2023 | 2024 | 2025 |
|---|---|---|---|---|---|---|---|---|---|---|---|---|---|---|---|---|---|---|---|
No. of unique herds with at least one case | 7479 | 6363 | 5764 | 5238 | 5218 | 4776 | 4449 | 4108 | 3949 | 4189 | 4209 | 4384 | 5202 | 5079 | 5034 | 5696 | 6899 | 6642 | |
No. of BDs that ended in year | 7005 (8.1) | 6449 (7.4) | 5540 (6.4) | 5023 (5.8) | 4727 (5.4) | 4547 (5.2) | 4410 (5.1) | 3918 (4.5) | 3642 (4.2) | 3730 (4.3) | 3813 (4.4) | 3916 (4.5) | 4392 (5.1) | 4610 (5.3) | 4561 (5.3) | 4728 (5.4) | 5413 (6.2) | 6388 (7.4) | |
Median (IQR) no. of cases per BD | 2 (1-4) | 2 (1-4) | 2 (1-4) | 1 (1-3) | 2 (1-4) | 1 (1-3) | 1 (1-3) | 1 (1-3) | 1 (1-3) | 1 (1-3) | 1 (1-3) | 1 (1-3) | 2 (1-4) | 2 (1-4) | 2 (1-4) | 2 (1-5) | 2 (1-5) | 2 (1-6) | |
Range of no. of cases in BDs that started in the year | 1-237 | 1-208 | 1-169 | 1-176 | 1-226 | 1-296 | 1-224 | 1-295 | 1-303 | 1-265 | 1-306 | 1-291 | 1-193 | 1-171 | 1-396 | 1-209 | 1-245 | 1-374 | |
BDs by no. of bTB cases | 1 | 3350 (47.8) | 3024 (46.9) | 2761 (49.8) | 2575 (51.3) | 2326 (49.2) | 2311 (50.8) | 2306 (52.3) | 2099 (53.6) | 1959 (53.8) | 1970 (52.8) | 1965 (51.5) | 1986 (50.7) | 2097 (47.7) | 2105 (45.7) | 2205 (48.3) | 2176 (46) | 2259 (41.7) | 2372 (37.1) |
2 | 1063 (15.2) | 959 (14.9) | 852 (15.4) | 770 (15.3) | 770 (16.3) | 756 (16.6) | 677 (15.4) | 562 (14.3) | 584 (16) | 581 (15.6) | 622 (16.3) | 636 (16.2) | 670 (15.3) | 697 (15.1) | 700 (15.3) | 696 (14.7) | 867 (16) | 971 (15.2) | |
3 | 608 (8.7) | 552 (8.6) | 445 (8) | 440 (8.8) | 387 (8.2) | 350 (7.7) | 362 (8.2) | 305 (7.8) | 272 (7.5) | 281 (7.5) | 287 (7.5) | 326 (8.3) | 348 (7.9) | 398 (8.6) | 363 (8) | 417 (8.8) | 441 (8.1) | 607 (9.5) | |
4 | 390 (5.6) | 346 (5.4) | 308 (5.6) | 281 (5.6) | 250 (5.3) | 221 (4.9) | 214 (4.9) | 187 (4.8) | 155 (4.3) | 140 (3.8) | 149 (3.9) | 196 (5) | 234 (5.3) | 292 (6.3) | 216 (4.7) | 247 (5.2) | 351 (6.5) | 386 (6) | |
5 | 255 (3.6) | 257 (4) | 208 (3.8) | 173 (3.4) | 176 (3.7) | 154 (3.4) | 163 (3.7) | 122 (3.1) | 100 (2.7) | 73 (2) | 88 (2.3) | 111 (2.8) | 154 (3.5) | 165 (3.6) | 148 (3.2) | 175 (3.7) | 202 (3.7) | 278 (4.4) | |
6 | 227 (3.2) | 208 (3.2) | 157 (2.8) | 135 (2.7) | 138 (2.9) | 133 (2.9) | 101 (2.3) | 97 (2.5) | 78 (2.1) | 75 (2) | 67 (1.8) | 79 (2) | 112 (2.6) | 143 (3.1) | 135 (3) | 129 (2.7) | 159 (2.9) | 211 (3.3) | |
7 | 154 (2.2) | 138 (2.1) | 100 (1.8) | 81 (1.6) | 105 (2.2) | 92 (2) | 77 (1.7) | 69 (1.8) | 56 (1.5) | 58 (1.6) | 62 (1.6) | 81 (2.1) | 96 (2.2) | 96 (2.1) | 81 (1.8) | 117 (2.5) | 111 (2.1) | 167 (2.6) | |
8 | 108 (1.5) | 127 (2) | 85 (1.5) | 66 (1.3) | 80 (1.7) | 69 (1.5) | 62 (1.4) | 52 (1.3) | 42 (1.2) | 67 (1.8) | 47 (1.2) | 66 (1.7) | 76 (1.7) | 78 (1.7) | 79 (1.7) | 80 (1.7) | 102 (1.9) | 149 (2.3) | |
9 | 95 (1.4) | 102 (1.6) | 63 (1.1) | 68 (1.4) | 57 (1.2) | 61 (1.3) | 49 (1.1) | 50 (1.3) | 34 (0.9) | 40 (1.1) | 32 (0.8) | 51 (1.3) | 61 (1.4) | 54 (1.2) | 60 (1.3) | 69 (1.5) | 81 (1.5) | 95 (1.5) | |
10-14 | 312 (4.5) | 300 (4.7) | 217 (3.9) | 186 (3.7) | 182 (3.9) | 164 (3.6) | 160 (3.6) | 134 (3.4) | 126 (3.5) | 149 (4) | 172 (4.5) | 129 (3.3) | 221 (5) | 216 (4.7) | 216 (4.7) | 217 (4.6) | 282 (5.2) | 358 (5.6) | |
15-19 | 150 (2.1) | 140 (2.2) | 120 (2.2) | 54 (1.1) | 83 (1.8) | 71 (1.6) | 91 (2.1) | 76 (1.9) | 66 (1.8) | 72 (1.9) | 92 (2.4) | 89 (2.3) | 106 (2.4) | 120 (2.6) | 101 (2.2) | 116 (2.5) | 166 (3.1) | 234 (3.7) | |
20-24 | 96 (1.4) | 92 (1.4) | 64 (1.2) | 58 (1.2) | 53 (1.1) | 36 (0.8) | 36 (0.8) | 54 (1.4) | 54 (1.5) | 63 (1.7) | 64 (1.7) | 46 (1.2) | 64 (1.5) | 82 (1.8) | 76 (1.7) | 85 (1.8) | 109 (2) | 129 (2) | |
25-29 | 64 (0.9) | 46 (0.7) | 36 (0.6) | 29 (0.6) | 31 (0.7) | 29 (0.6) | 20 (0.5) | 32 (0.8) | 24 (0.7) | 34 (0.9) | 51 (1.3) | 35 (0.9) | 49 (1.1) | 43 (0.9) | 59 (1.3) | 57 (1.2) | 55 (1) | 106 (1.7) | |
30-34 | 36 (0.5) | 31 (0.5) | 31 (0.6) | 26 (0.5) | 23 (0.5) | 19 (0.4) | 15 (0.3) | 7 (0.2) | 18 (0.5) | 34 (0.9) | 29 (0.8) | 25 (0.6) | 21 (0.5) | 32 (0.7) | 31 (0.7) | 39 (0.8) | 61 (1.1) | 74 (1.2) | |
35-39 | 24 (0.3) | 24 (0.4) | 13 (0.2) | 17 (0.3) | 12 (0.3) | 24 (0.5) | 21 (0.5) | 5 (0.1) | 17 (0.5) | 22 (0.6) | 21 (0.6) | 17 (0.4) | 22 (0.5) | 16 (0.3) | 24 (0.5) | 32 (0.7) | 35 (0.6) | 54 (0.8) | |
40+ | 73 (1) | 103 (1.6) | 80 (1.4) | 64 (1.3) | 54 (1.1) | 57 (1.3) | 56 (1.3) | 67 (1.7) | 57 (1.6) | 71 (1.9) | 65 (1.7) | 43 (1.1) | 61 (1.4) | 73 (1.6) | 67 (1.5) | 76 (1.6) | 132 (2.4) | 197 (3.1) | |
BD initiated by | SICTT | 4881 (69.7) | 4552 (70.6) | 3701 (66.8) | 3556 (70.8) | 3446 (72.9) | 3270 (71.9) | 3188 (72.3) | 2881 (73.5) | 2725 (74.8) | 2758 (73.9) | 2821 (74) | 2936 (75) | 3308 (75.3) | 3318 (72) | 3008 (66) | 3227 (68.3) | 3842 (71) | 4677 (73.2) |
Slaughter (non permit animal) | 2124 (30.3) | 1897 (29.4) | 1839 (33.2) | 1467 (29.2) | 1281 (27.1) | 1277 (28.1) | 1222 (27.7) | 1037 (26.5) | 917 (25.2) | 972 (26.1) | 992 (26) | 980 (25) | 1073 (24.4) | 1111 (24.1) | 1187 (26) | 1218 (25.8) | 1293 (23.9) | 1397 (21.9) | |
IFN-γ | - | - | - | - | - | - | - | - | - | - | - | - | 11 (0.3) | 181 (3.9) | 366 (8) | 283 (6) | 278 (5.1) | 314 (4.9) | |
BD: herd-level bTB breakdown; SICTT: Single Intradermal Comparative Tuberculin Test; IFN-γ: interferon-gamma assay; AHCS: Animal Health Computer System | |||||||||||||||||||
7.9.2 BD duration
Year | N | mean | sd | median | min | max |
|---|---|---|---|---|---|---|
2008 | 7,005 | 0.5474375 | 0.3288191 | 0.4 | 0.2 | 3.7 |
2009 | 6,449 | 0.5546906 | 0.3803079 | 0.4 | 0.2 | 4.7 |
2010 | 5,540 | 0.5426354 | 0.3927235 | 0.4 | 0.2 | 5.8 |
2011 | 5,023 | 0.5531356 | 0.4363118 | 0.4 | 0.2 | 6.9 |
2012 | 4,727 | 0.5328538 | 0.4219806 | 0.4 | 0.2 | 6.8 |
2013 | 4,547 | 0.5361777 | 0.4642283 | 0.4 | 0.2 | 8.0 |
2014 | 4,410 | 0.5539229 | 0.5242621 | 0.4 | 0.2 | 8.5 |
2015 | 3,918 | 0.5450230 | 0.5881386 | 0.4 | 0.2 | 10.3 |
2016 | 3,642 | 0.5256727 | 0.5270829 | 0.4 | 0.2 | 10.0 |
2017 | 3,730 | 0.5308311 | 0.5454840 | 0.4 | 0.2 | 12.1 |
2018 | 3,813 | 0.5381327 | 0.5451194 | 0.4 | 0.2 | 11.2 |
2019 | 3,916 | 0.5222421 | 0.4011200 | 0.4 | 0.2 | 10.3 |
2020 | 4,392 | 0.5377505 | 0.5369815 | 0.4 | 0.2 | 12.4 |
2021 | 4,610 | 0.5300651 | 0.5094364 | 0.4 | 0.2 | 13.5 |
2022 | 4,561 | 0.5494190 | 0.5518869 | 0.4 | 0.2 | 15.6 |
2023 | 4,728 | 0.5221658 | 0.3726920 | 0.4 | 0.2 | 8.8 |
2024 | 5,413 | 0.5323481 | 0.4232406 | 0.4 | 0.2 | 17.9 |
2025 | 6,388 | 0.5388541 | 0.3323242 | 0.4 | 0.2 | 6.6 |
Year represents year the BD ended in (it could overlap multiple years) | ||||||
7.10 Notes
- Explore CFUs, perhaps I need to drop them or have them as a seperate group