per_type n percent valid_percent
ER26 333860 0.8177391543 0.8367921880
ER26A 2514 0.0061576596 0.0063011309
ER26B 292 0.0007152095 0.0007318736
ER26D 195 0.0004776228 0.0004887512
ER26GIF 50357 0.1233417917 0.1262156120
ER26R 281 0.0006882666 0.0007043030
ER26S 10492 0.0256985539 0.0262973211
ER26SGIF 985 0.0024126073 0.0024688202
<NA> 9296 0.0227691343 NA5 Prevalence of visible lesions seperately by SICTT and IFN-γ positive animals at slaughter
\(~\) \(~\)
5.1 Introduction
This page presents the prevalence of visible lesions at slaughter within bTB positive animals separately by those classified by the SICTT and IFN-γ. There was no facility within AHCS prior to May 2019 to record IFN-γ positive animals. Before this, if an animal had a positive IFN-γ result, their SICTT results were reinterpreted as positive. As a result, we have had to use old raw IFN-γ data to try and differentiate between which animals were positive on IFN-γ or SICTT. The old data has some missing tag numbers etc. and so we cannot be certain that we have assigned all cases to either IFN-γ or SICTT correctly. However, we believe, the vast majority of the data is correct.
This is the difference between overall lesion prevalence page and this one (i.e. we make an attempt to seperate SICTT and IFN-γ positive trends).
5.2 Definitions
5.2.1 Proportion of animals with lesions at routine slaughter
If an animal is classified as bTB positive before entering an abattoir or a meatplant, it must have a permit to enter. Any animal with a permit will get a visual inspection for lesions. In rare instances, a bTB positive animal may be sent to a knackery instead of an abattoir or meatplant (e.g. if the animal dies before being sent to the factory). In these cases, a permit may not be issued and a visual inspection does not routinely take place in a knackery. For these reasons, only animals with a permit (and thus, a visual check completed) are considered for this document.
Of all SICTT and IFN-γ positive animals, this is the breakdown of the number of animals with a permit:
Of importance here is that ER26GIF and ER26SGIF permits refer to IFN-γ bTB positive animals. As mentioned above, these did not exist on AHCS prior to May 2019.
\(~\) \(~\)
\(~\) \(~\)
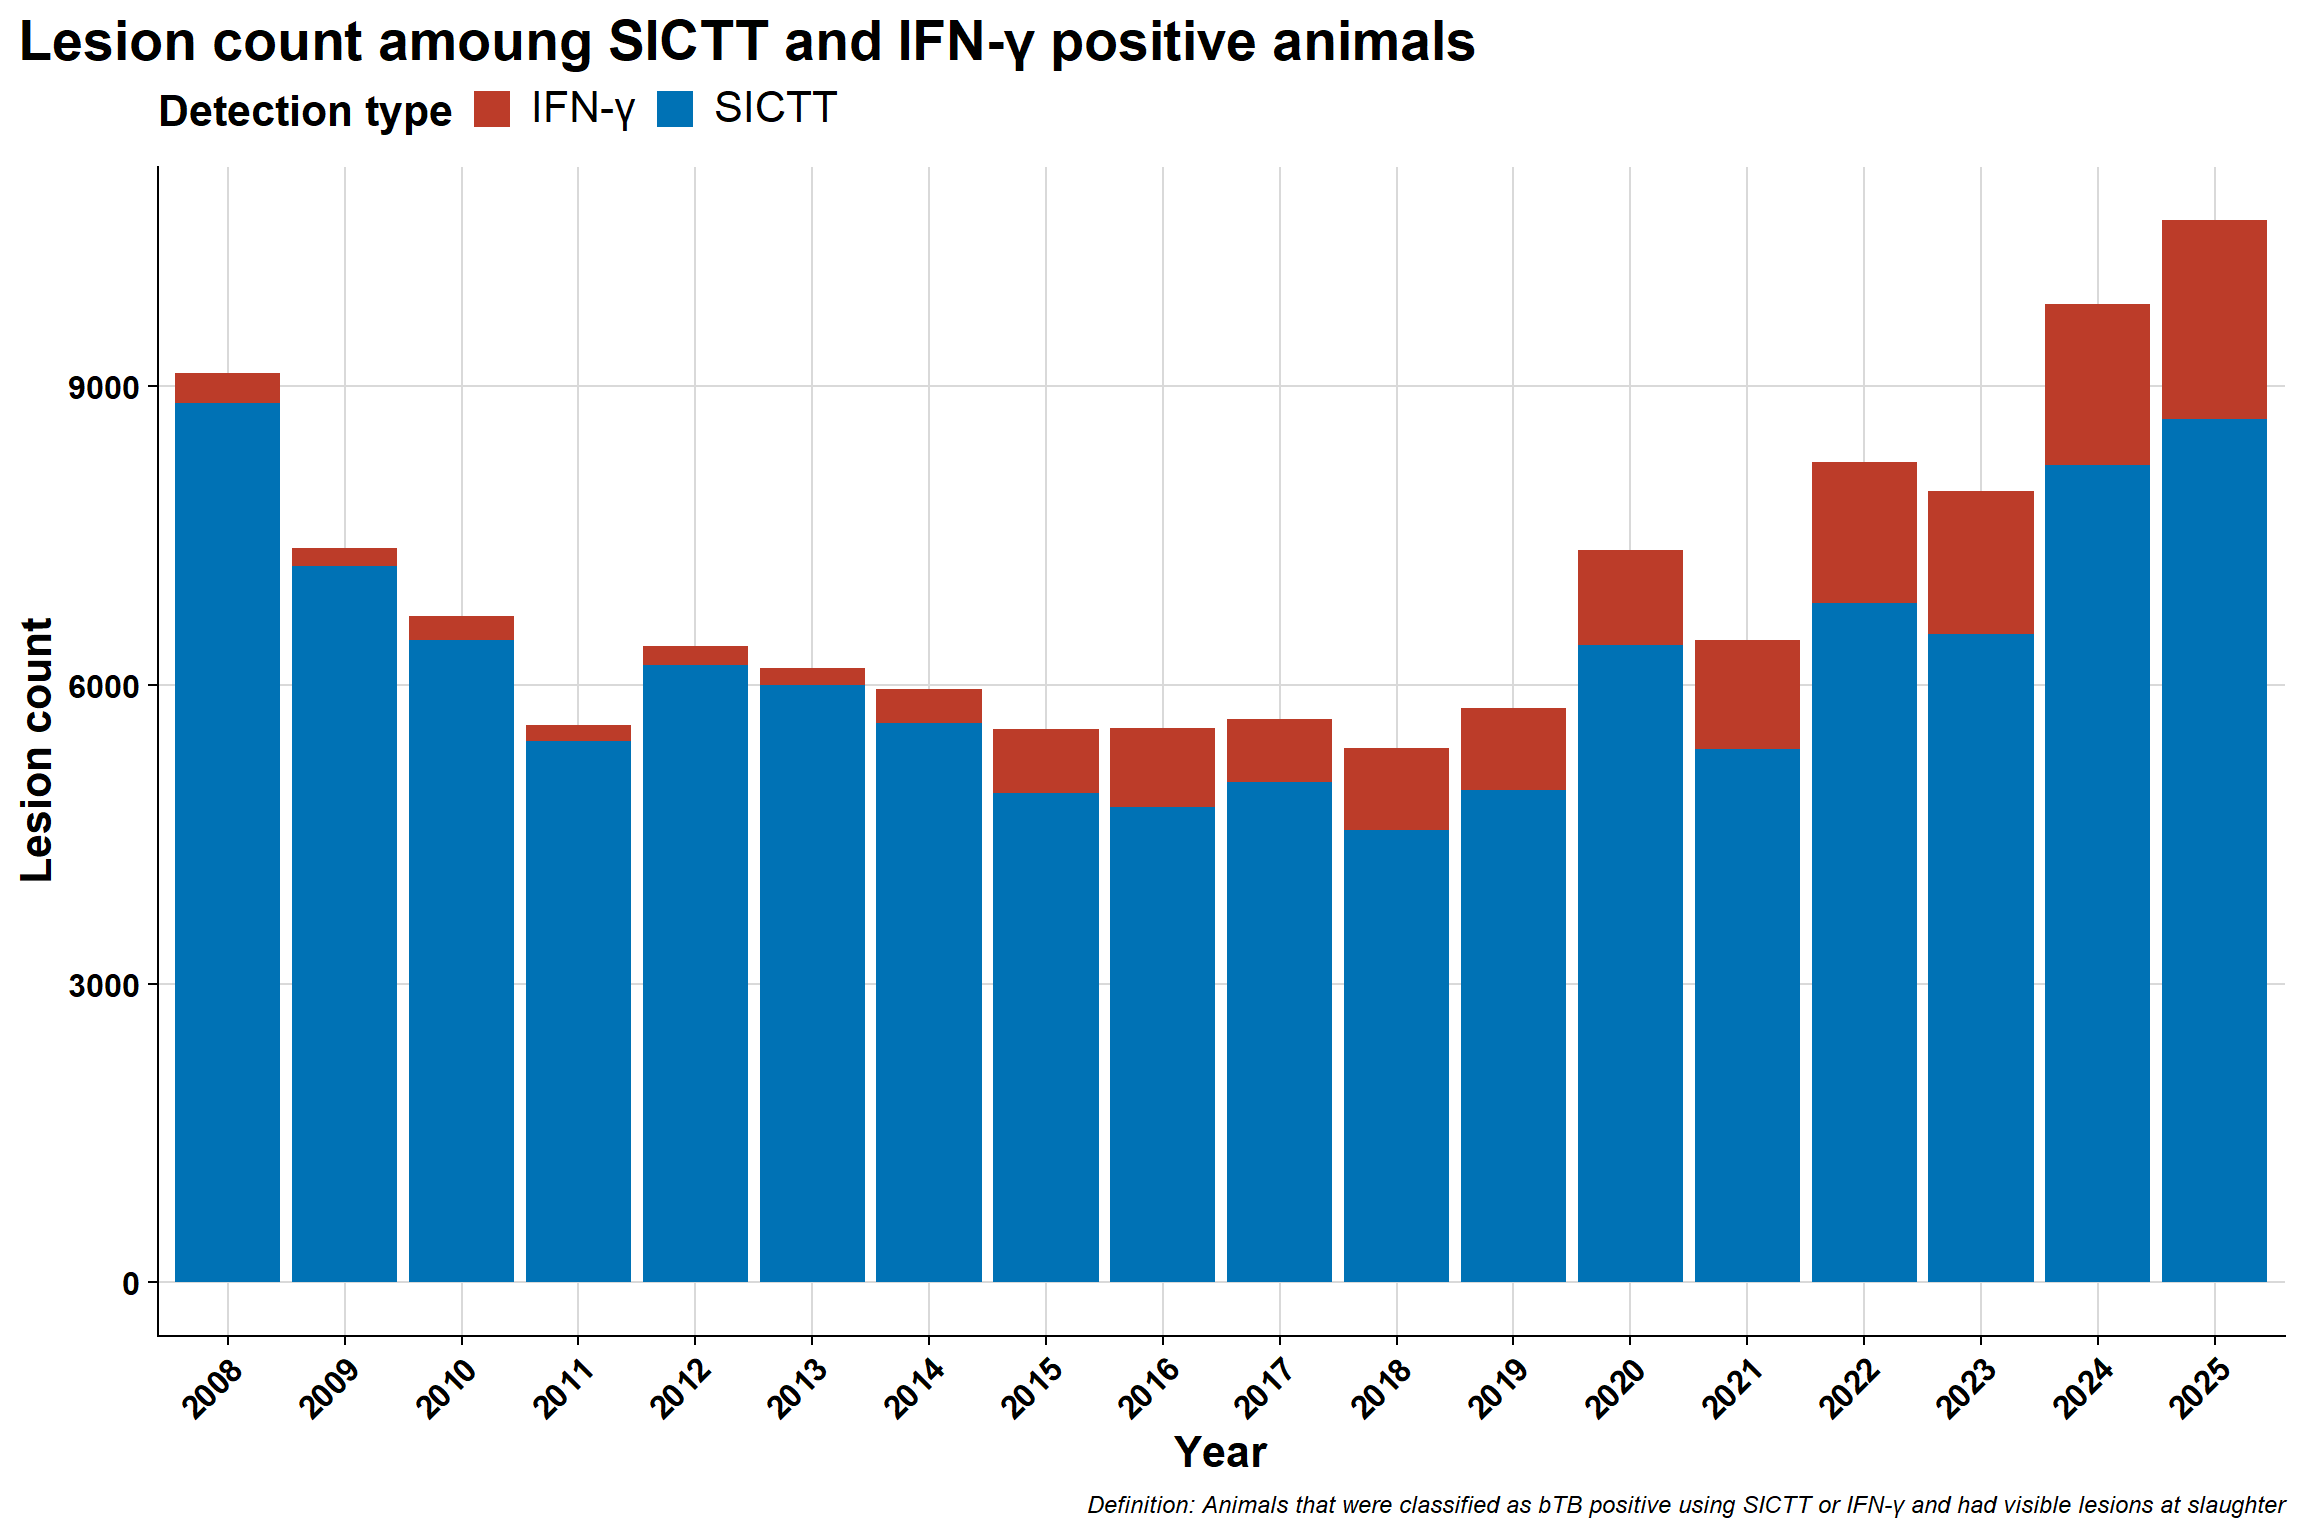
5.3 Lesion counts
Before looking at lesion prevalence, the count of lesions by detection method is plotted below as a method to look at absolute numbers which can be telling a different story.
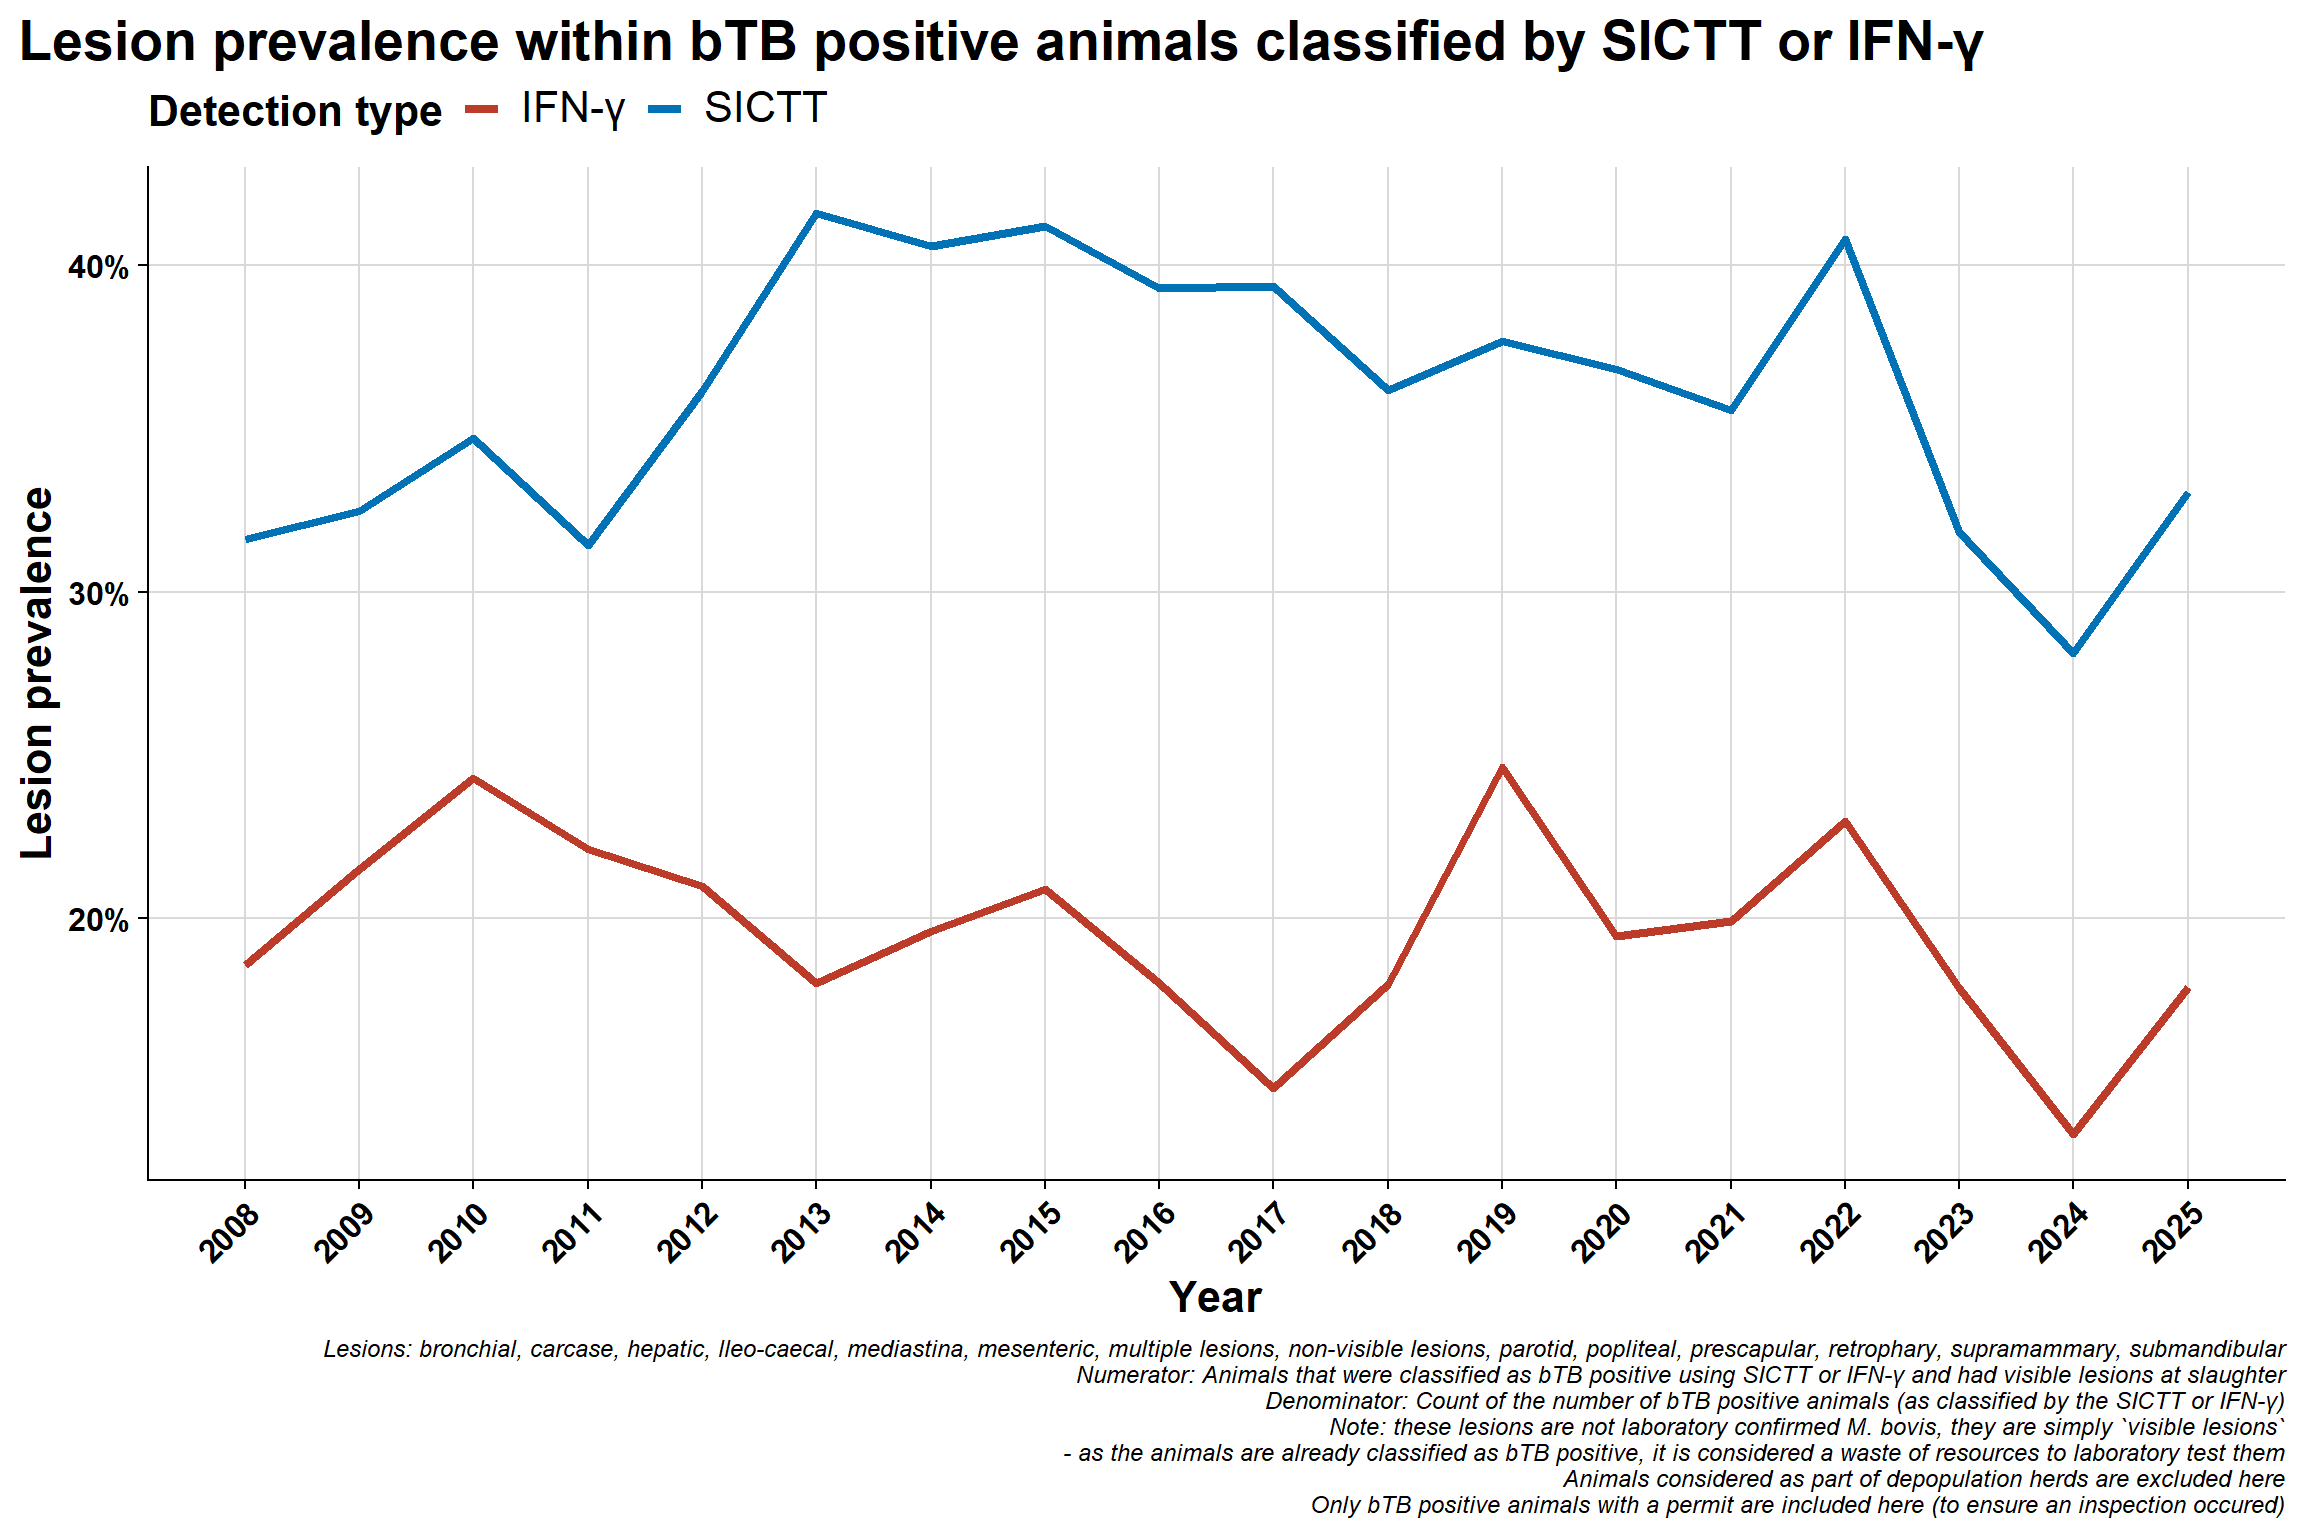
5.4 Overall lesion prevalence (seperately by SICTT or IFN-γ)
5.4.1 All animals combined:
\(~\) \(~\)
\(~\) \(~\)
5.4.2 All animals combined monthly:
\(~\) \(~\)
5.4.2.1 Interactive
\(~\) \(~\)
\(~\) \(~\)
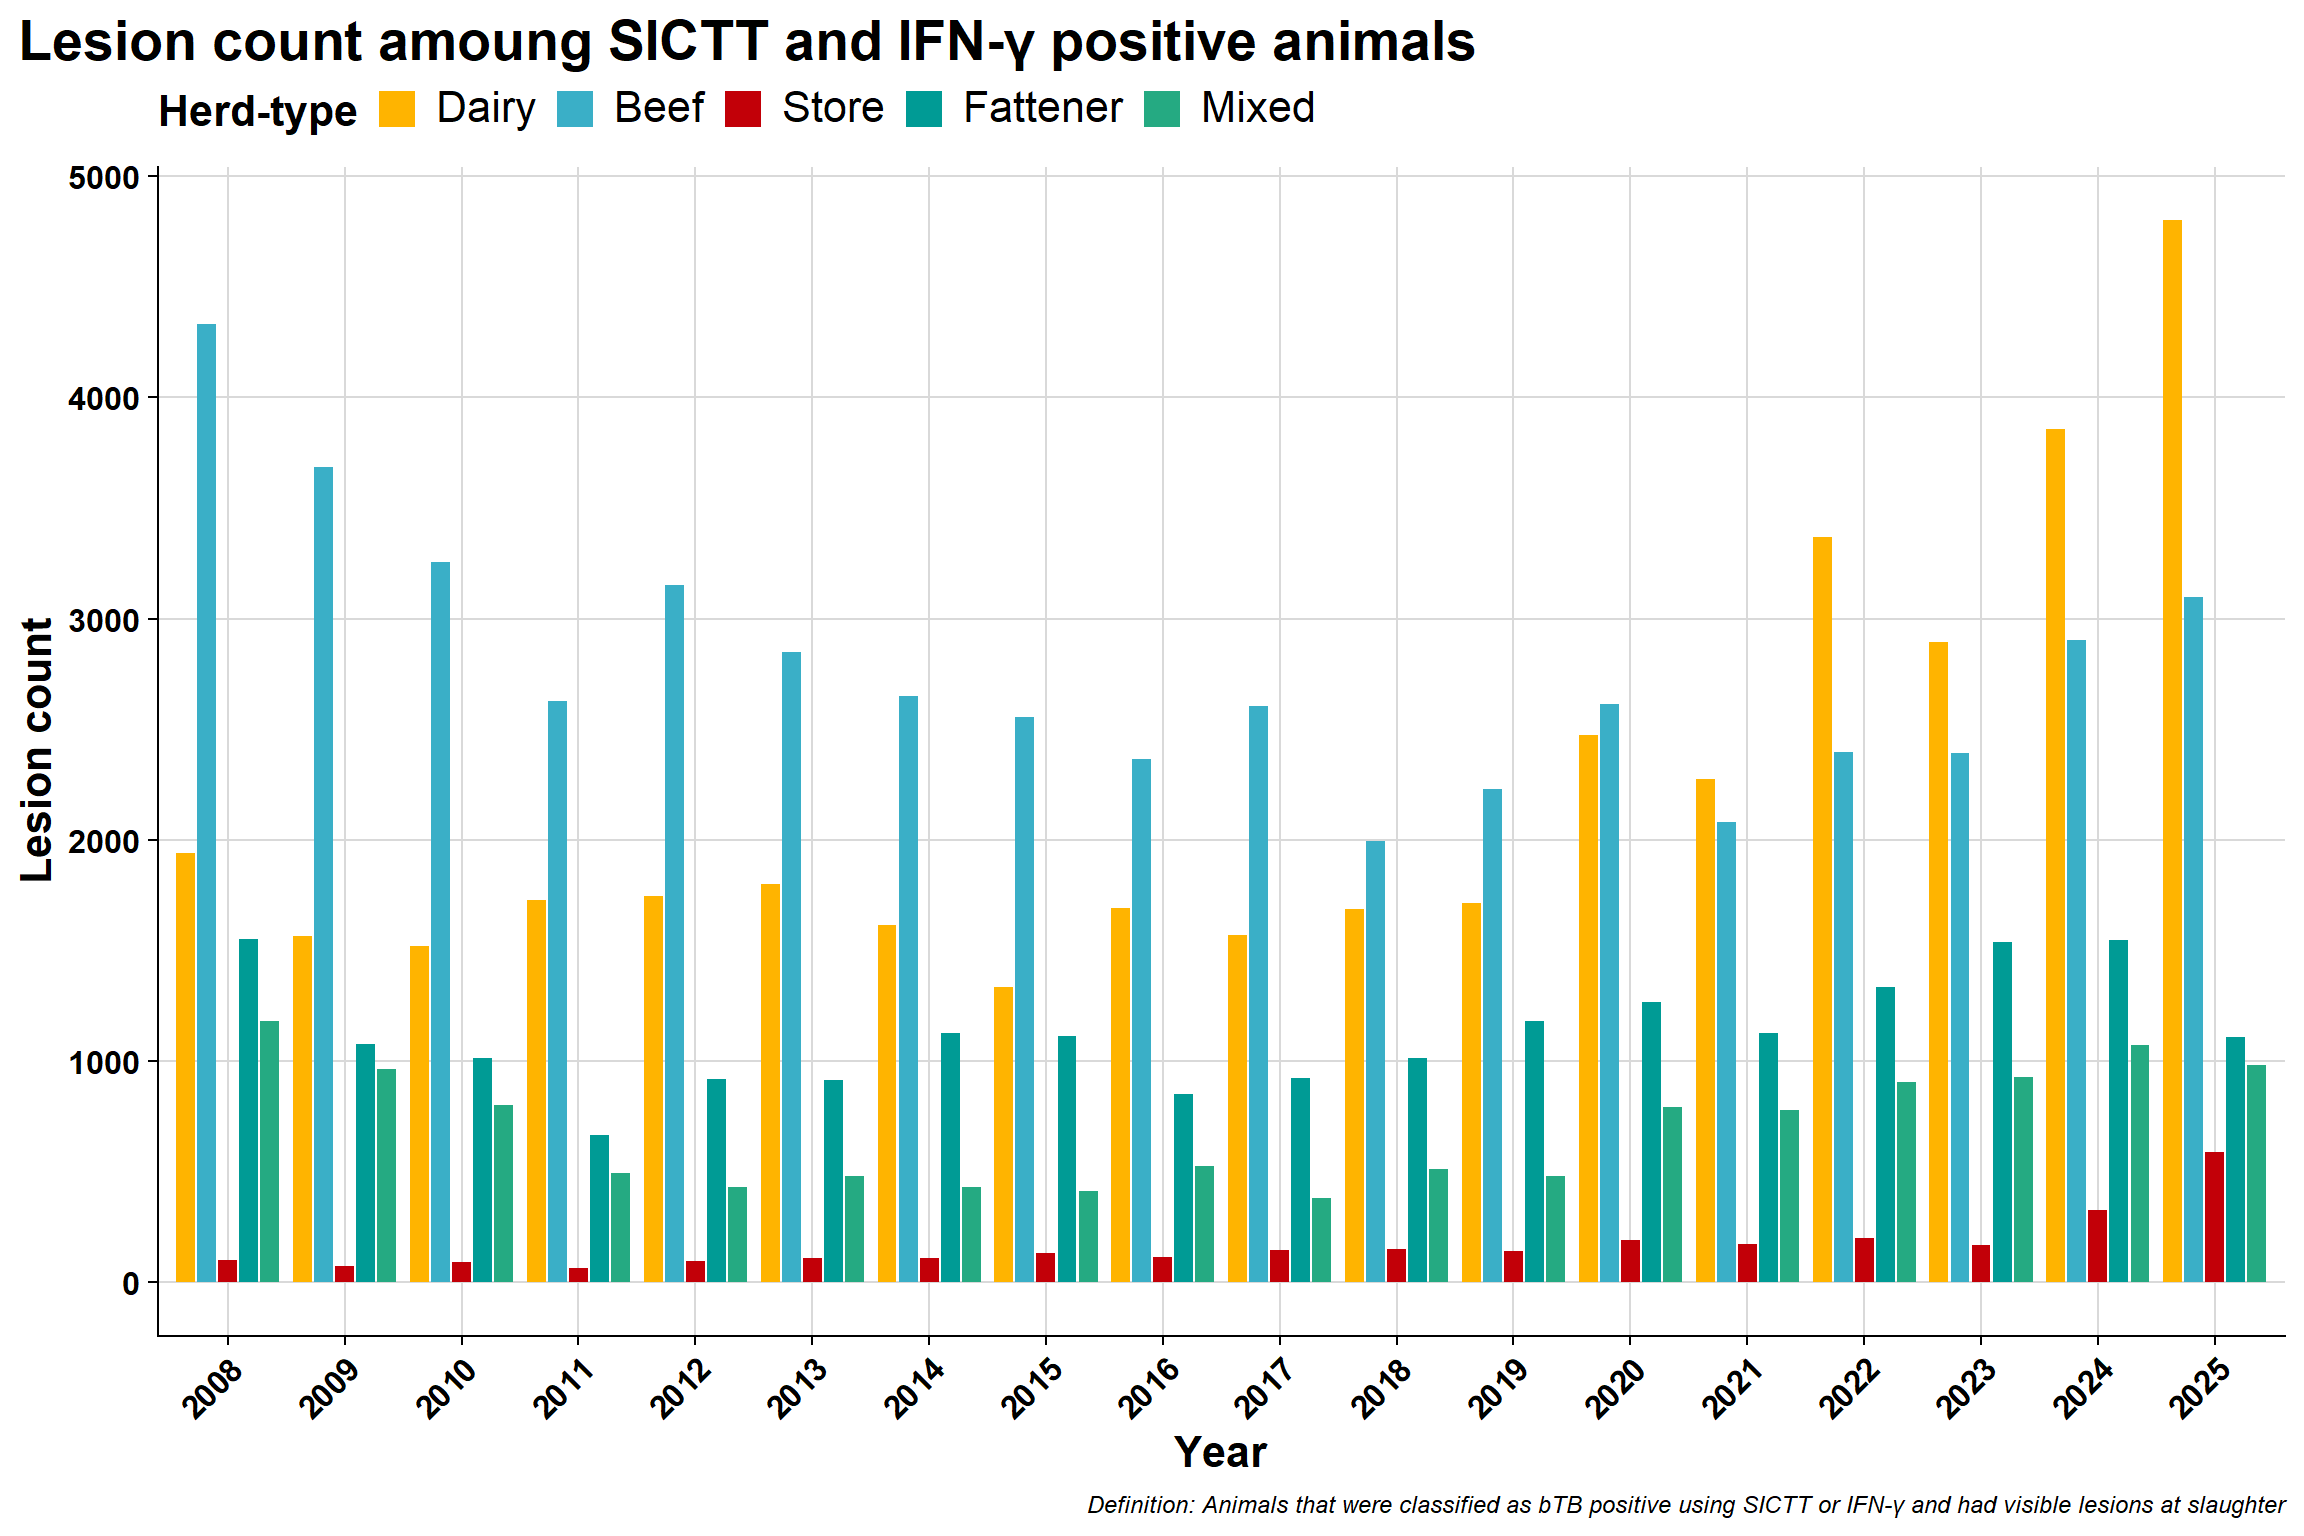
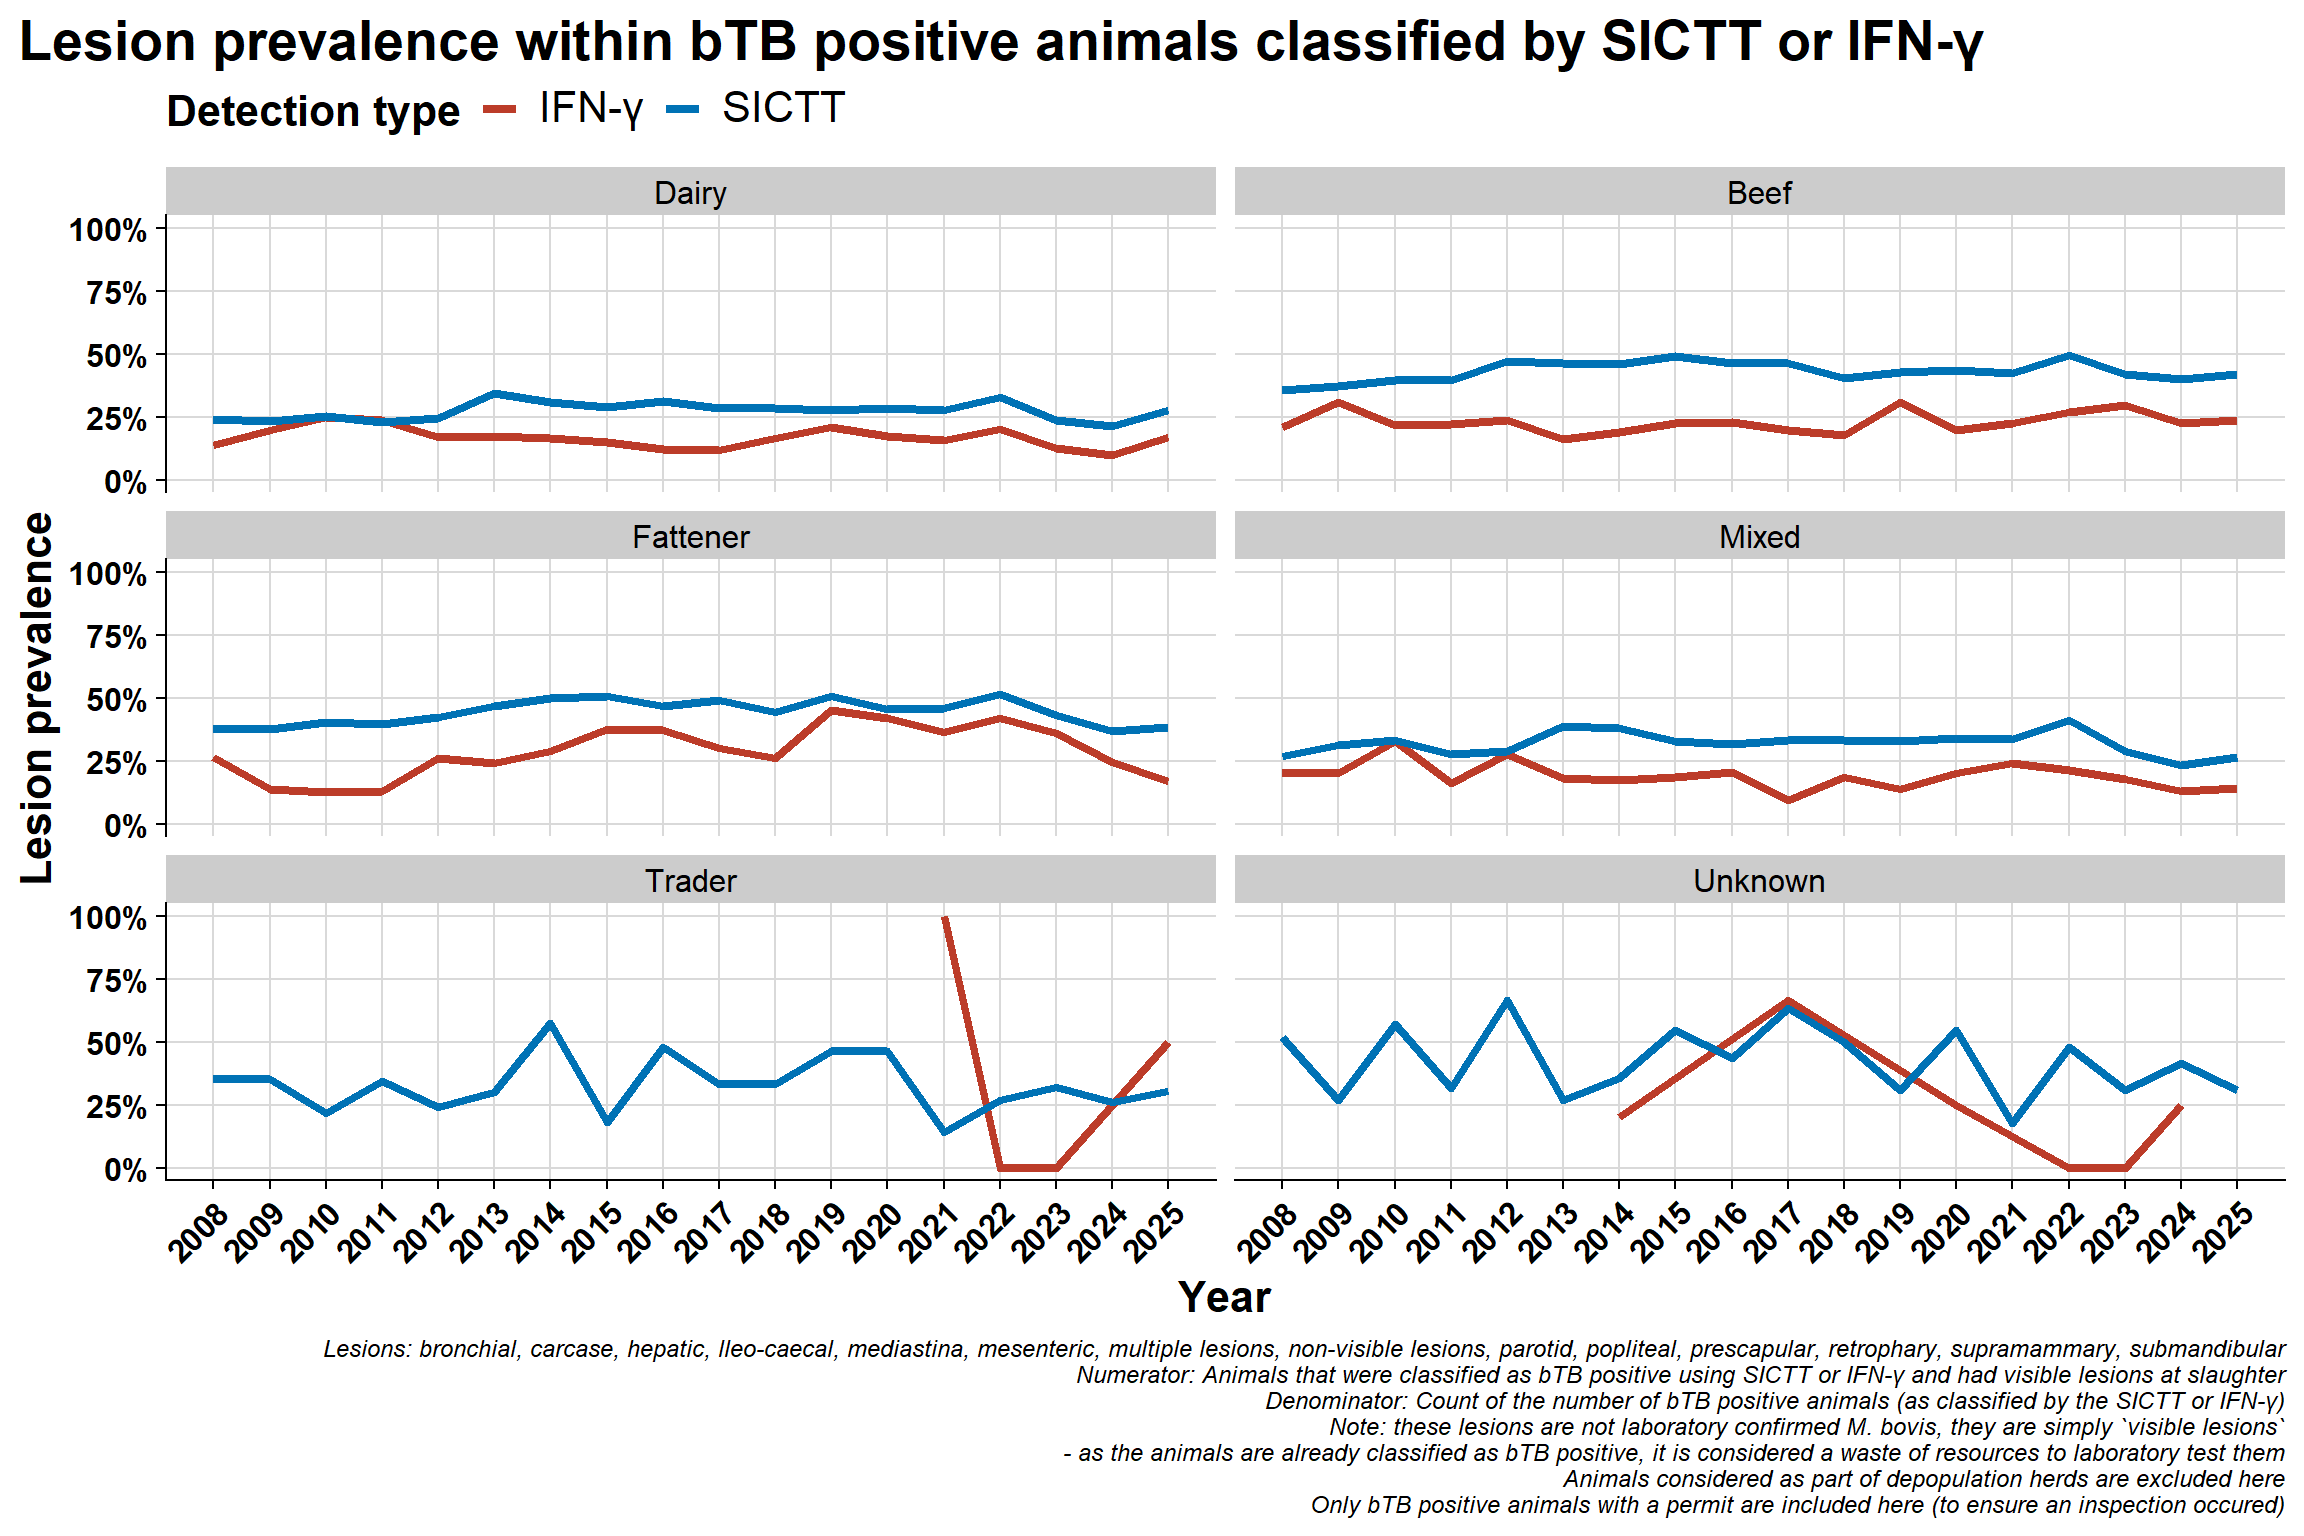
5.4.3 AHCS herd-type per year
\(~\) \(~\)
\(~\) \(~\)
\(~\) \(~\)
5.4.4 AHCS herd-type per month
\(~\) \(~\)
5.4.4.1 Interactive
\(~\)
\(~\) \(~\)
\(~\) \(~\)
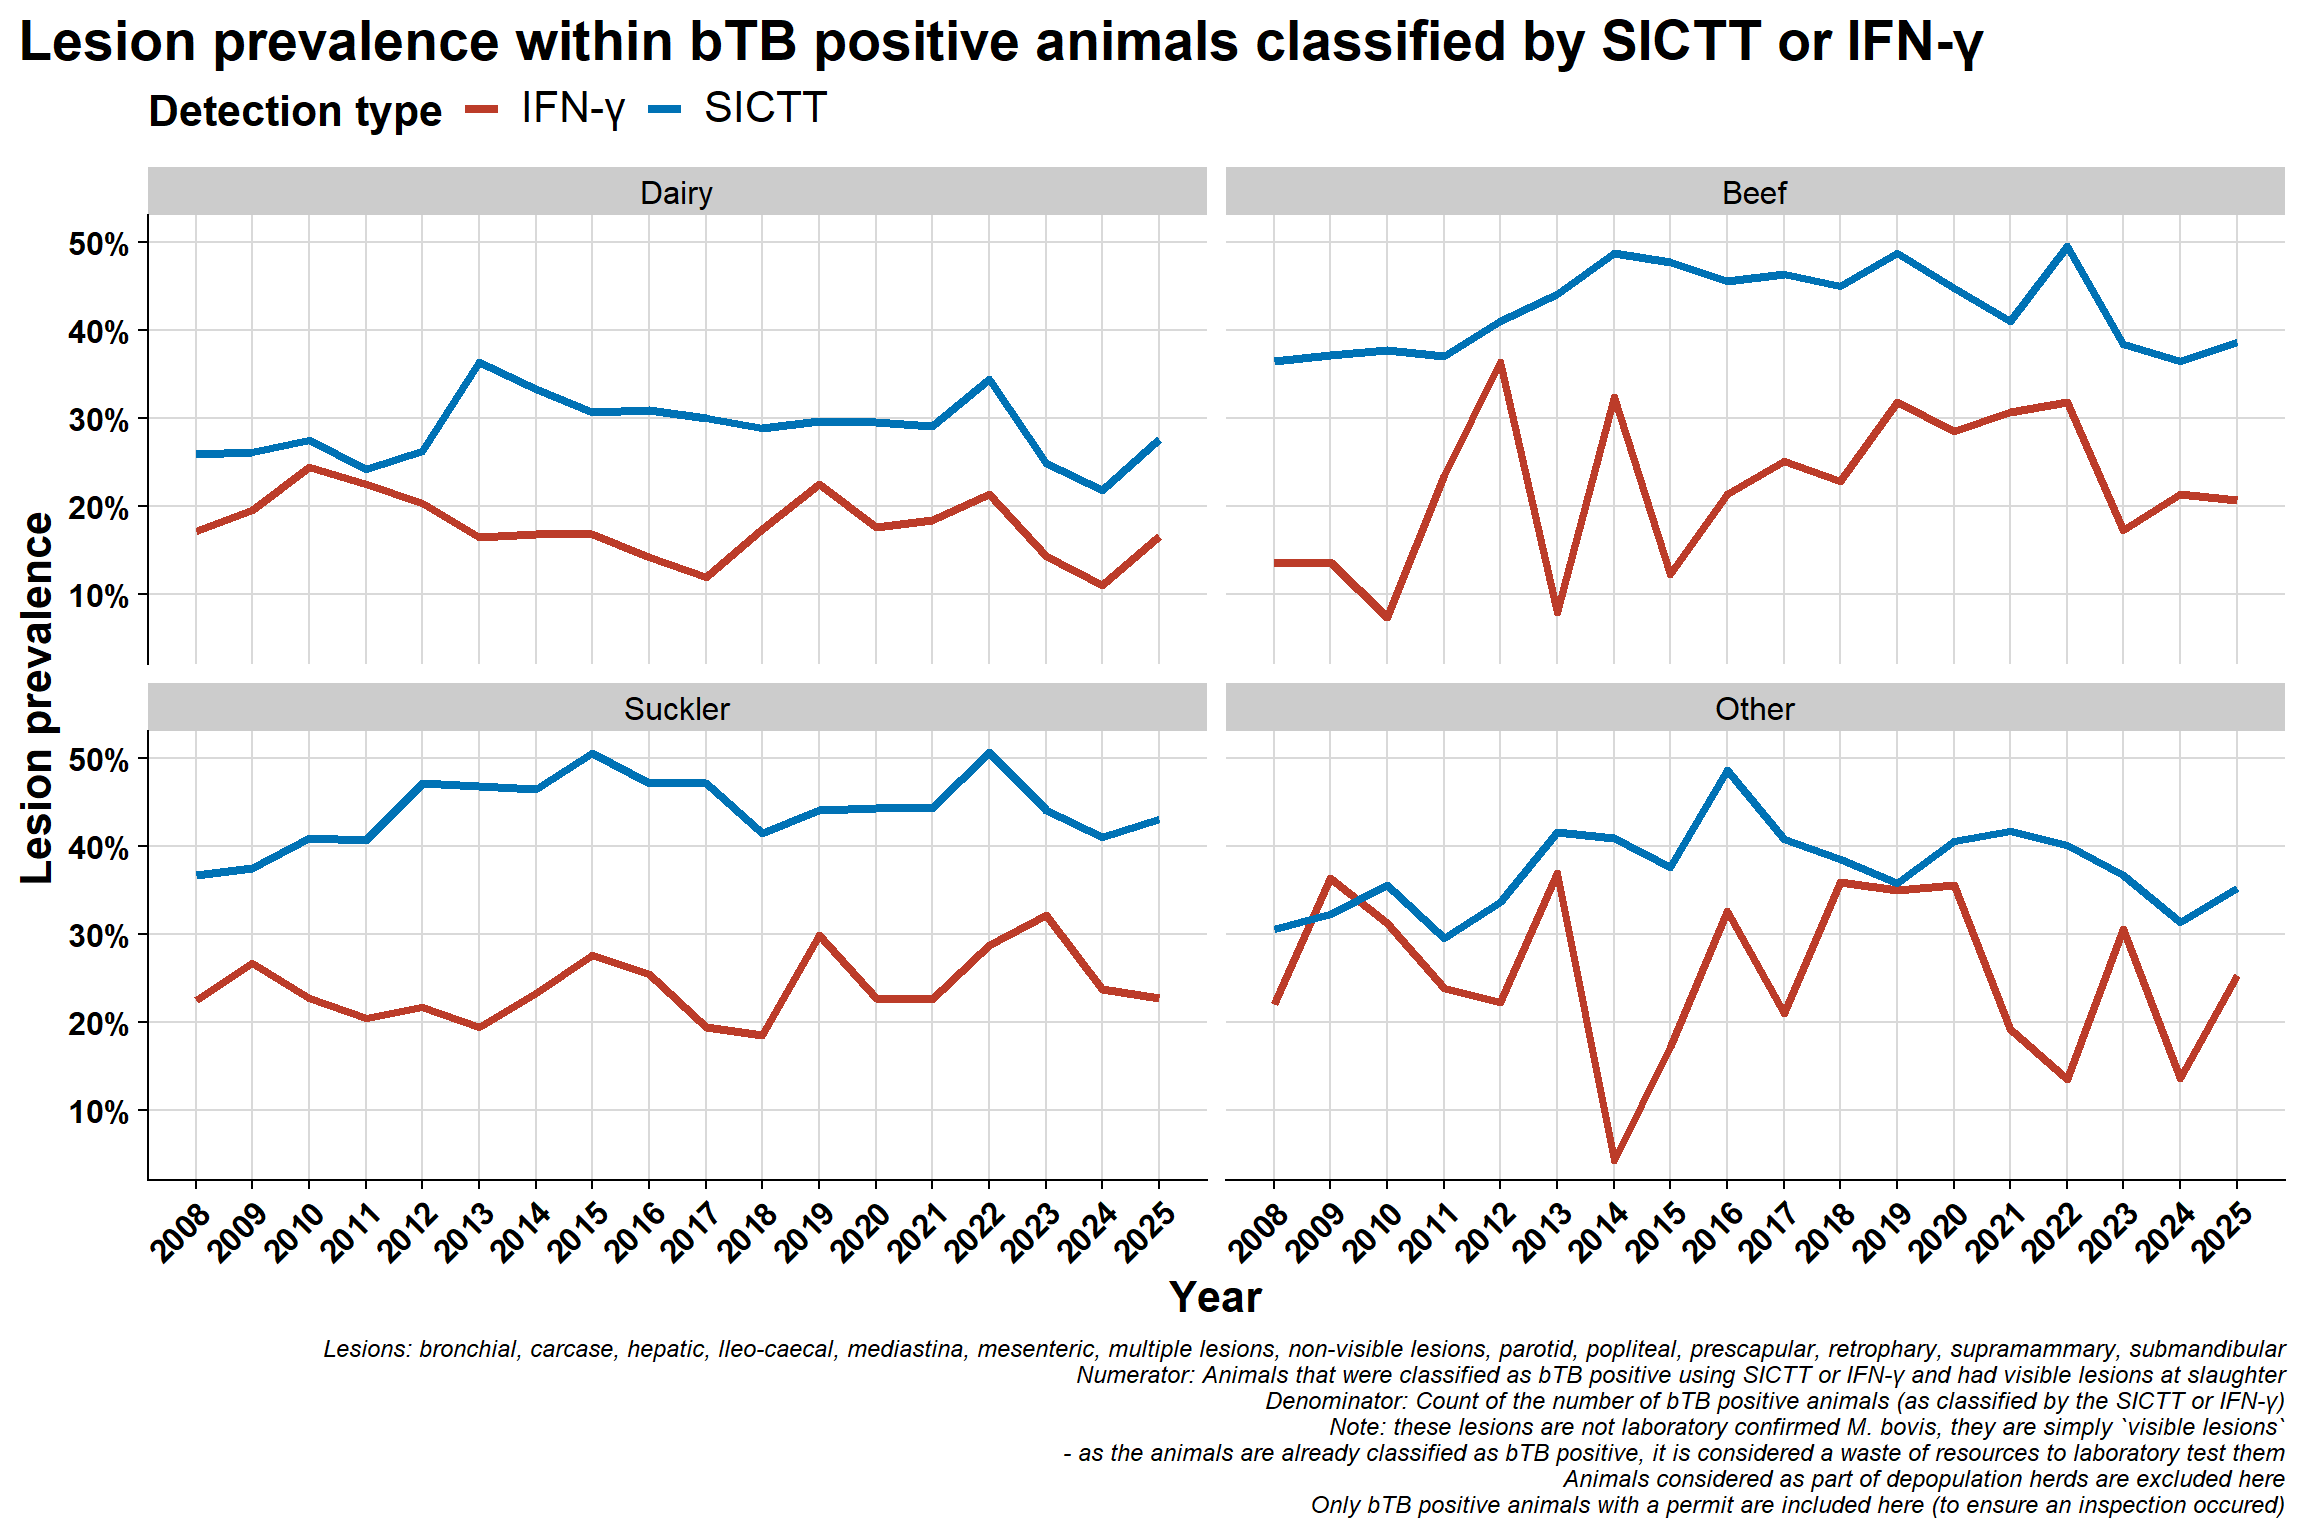
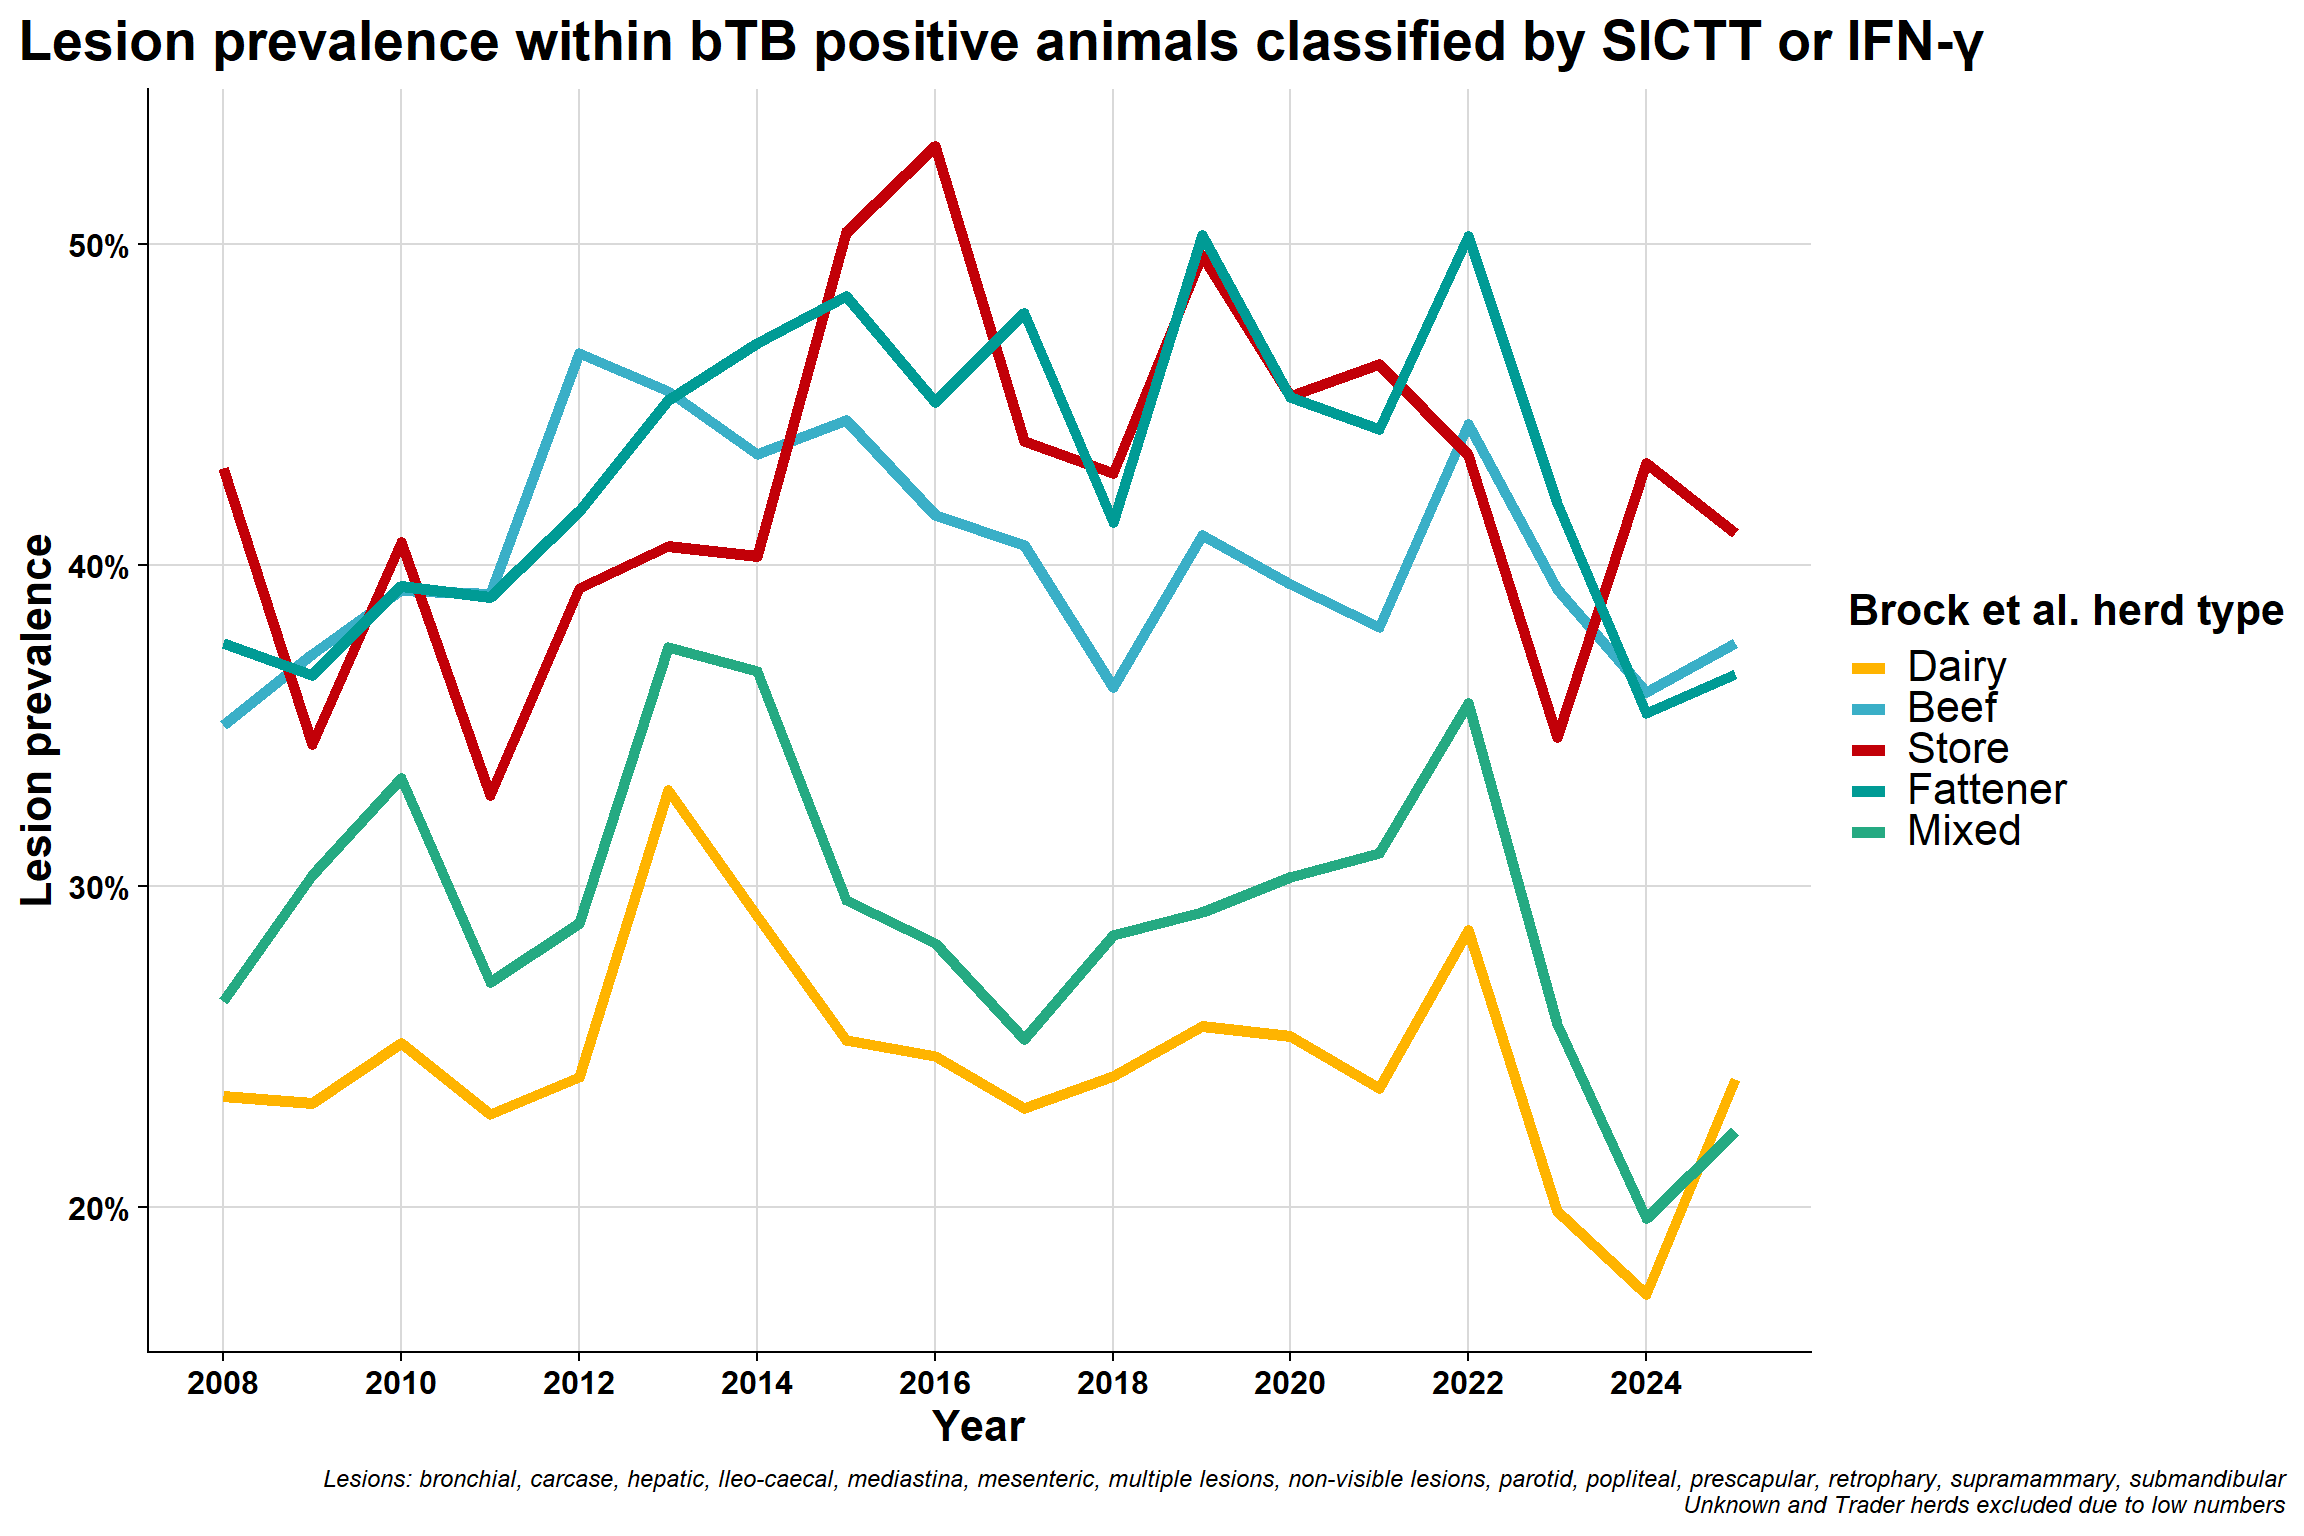
5.4.5 Brock et al. herd-types per year
\(~\) \(~\)
\(~\) \(~\)
\(~\) \(~\)
5.4.5.1 Overall lesion rate in both combined
\(~\) \(~\)
5.4.6 Brock et al. herd-types per month
\(~\) \(~\)
5.4.6.1 Interactive
\(~\)
\(~\) \(~\)
\(~\) \(~\)
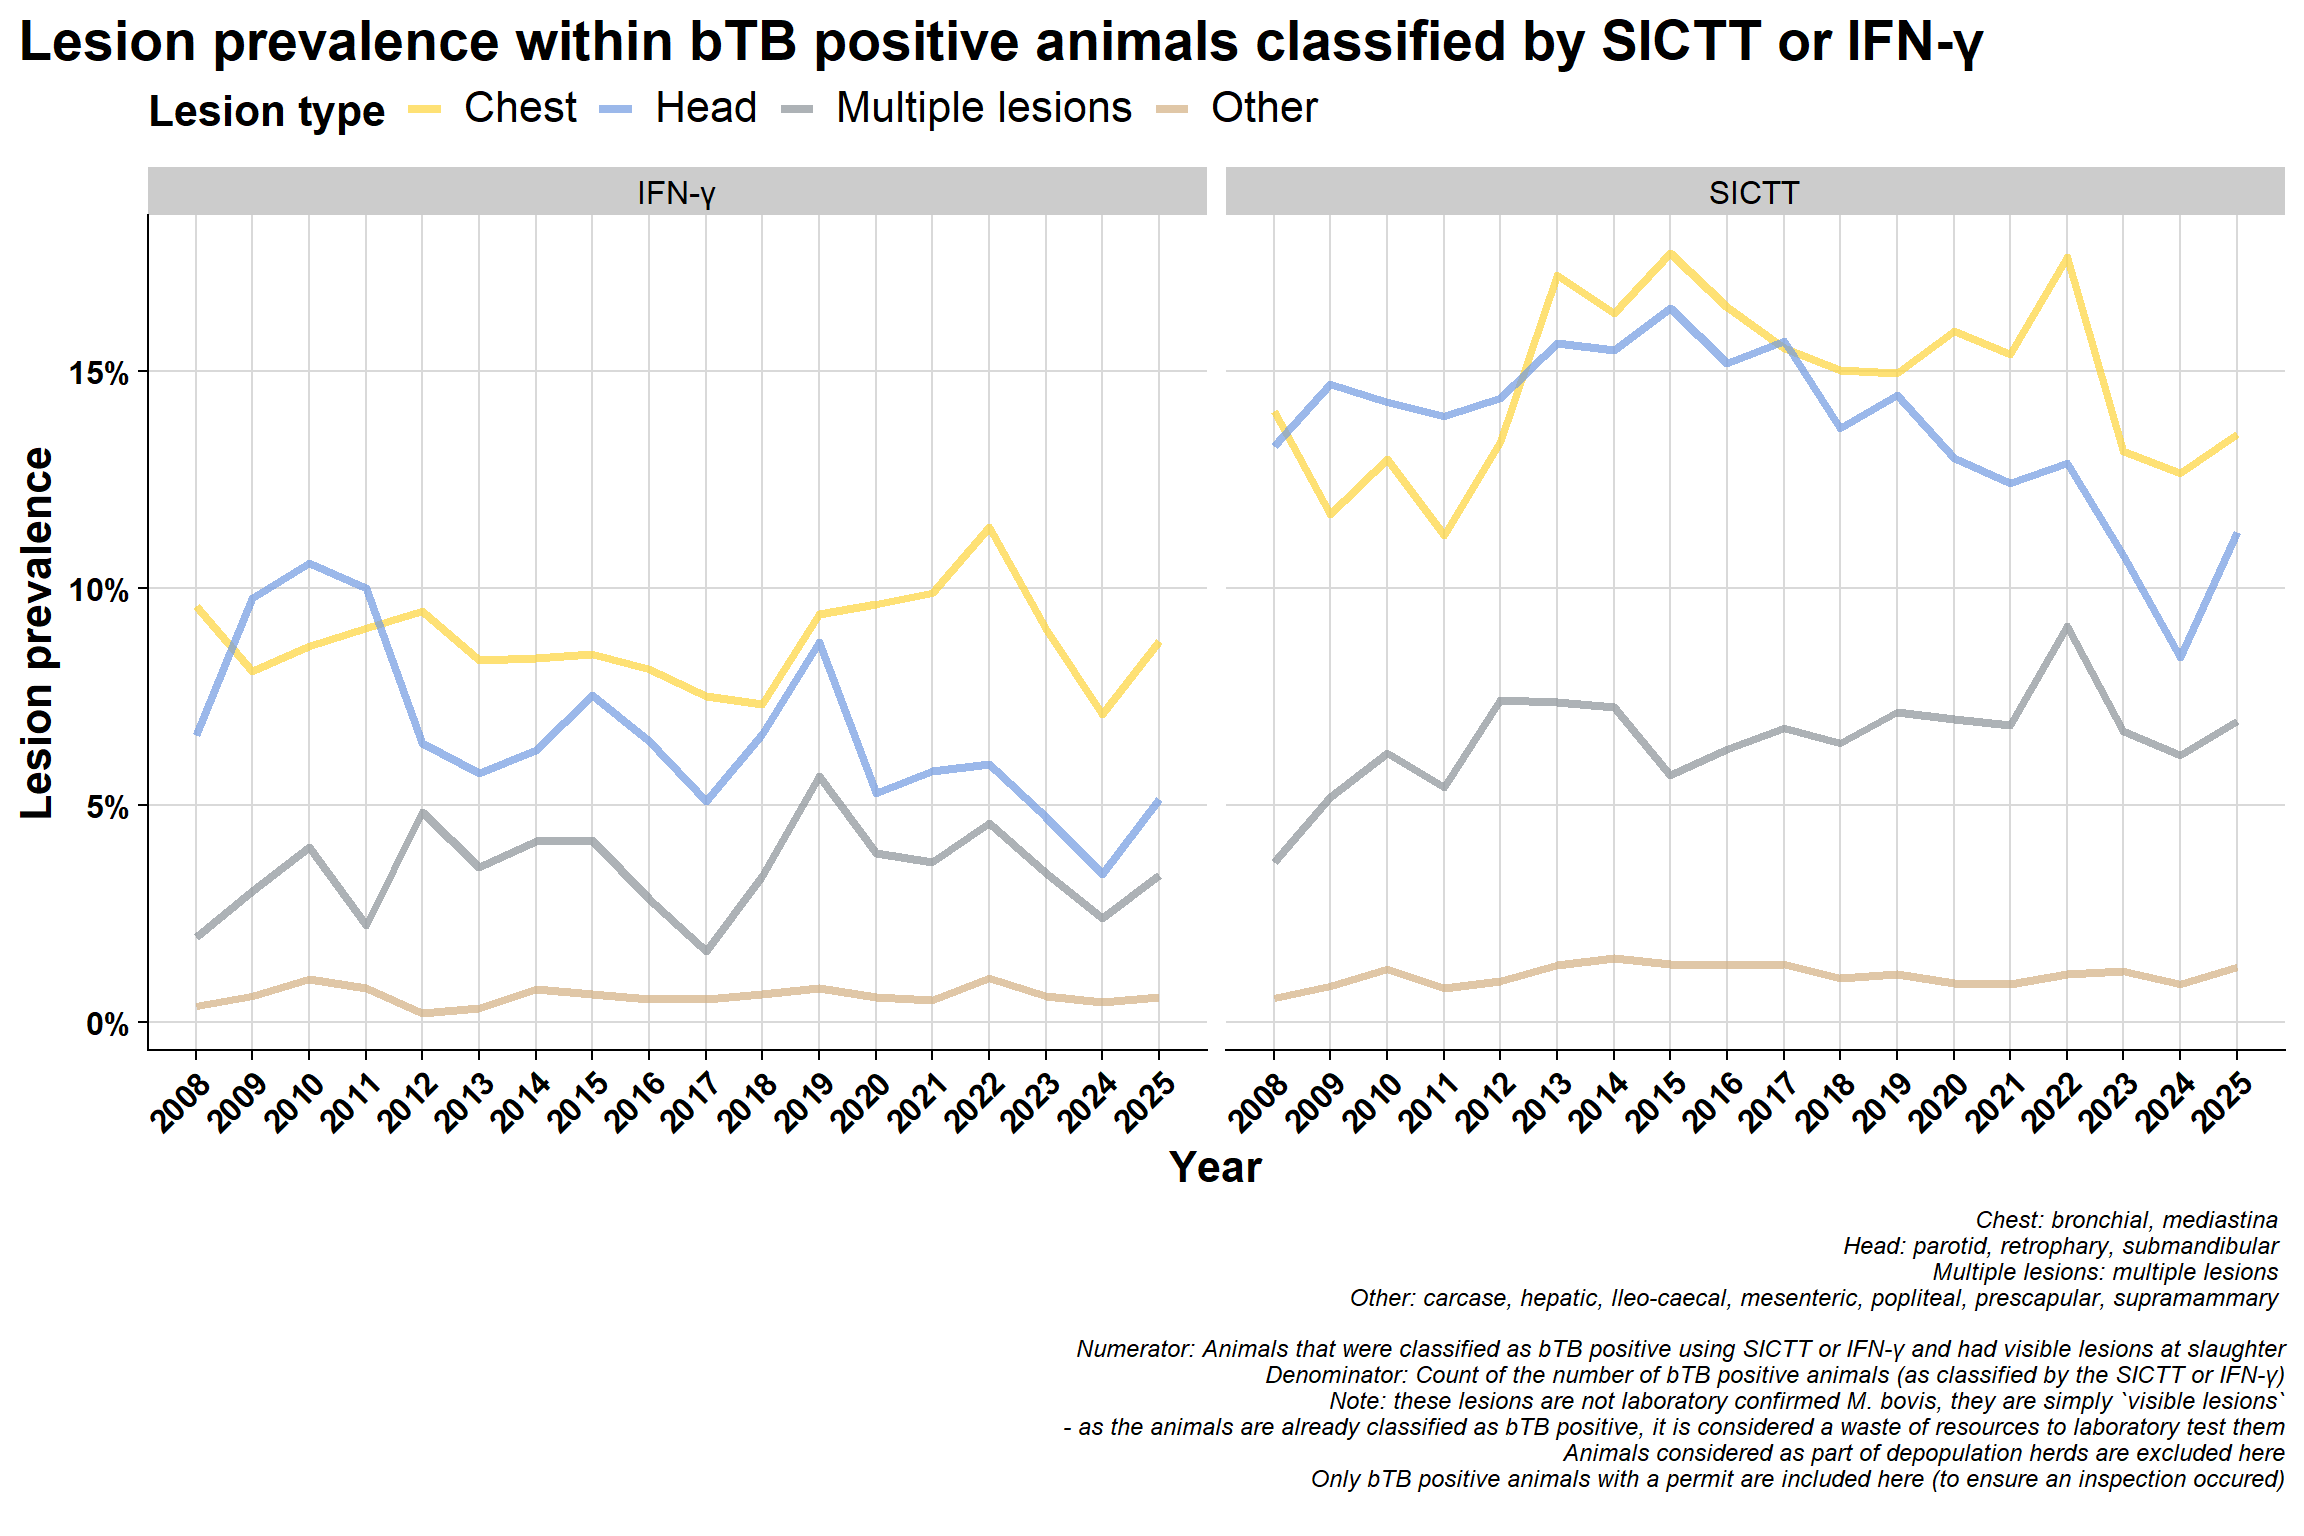
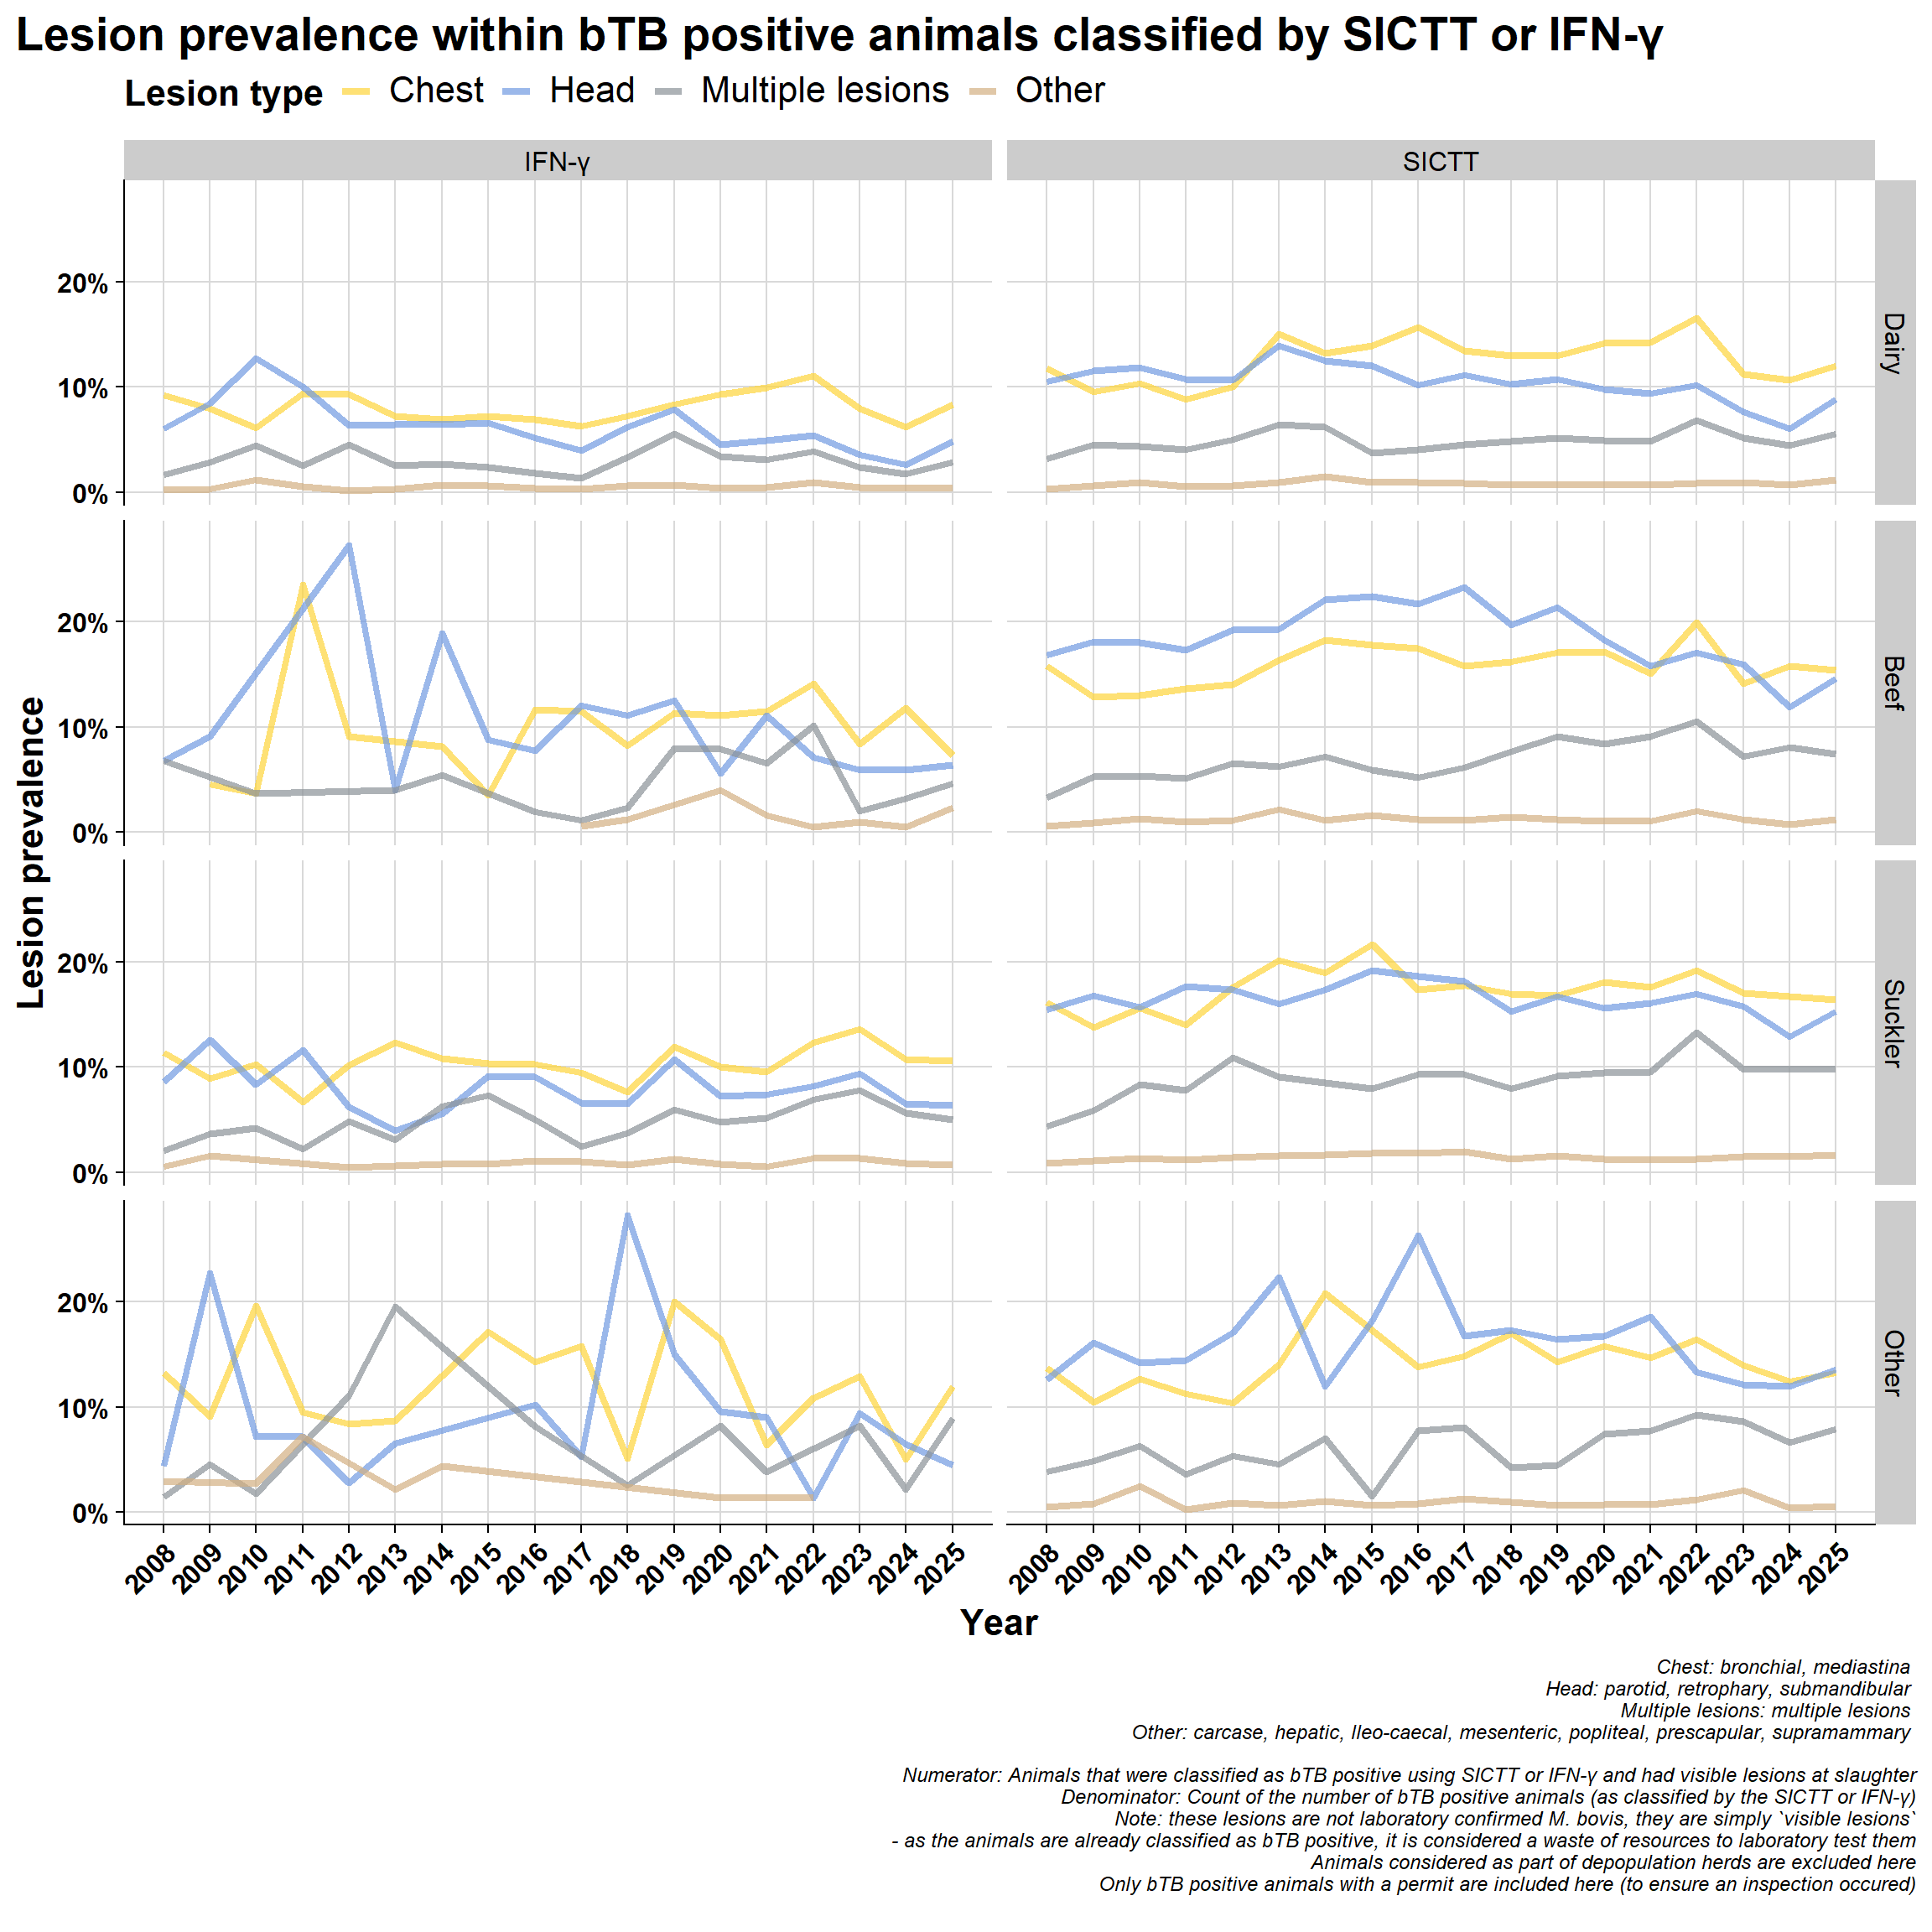
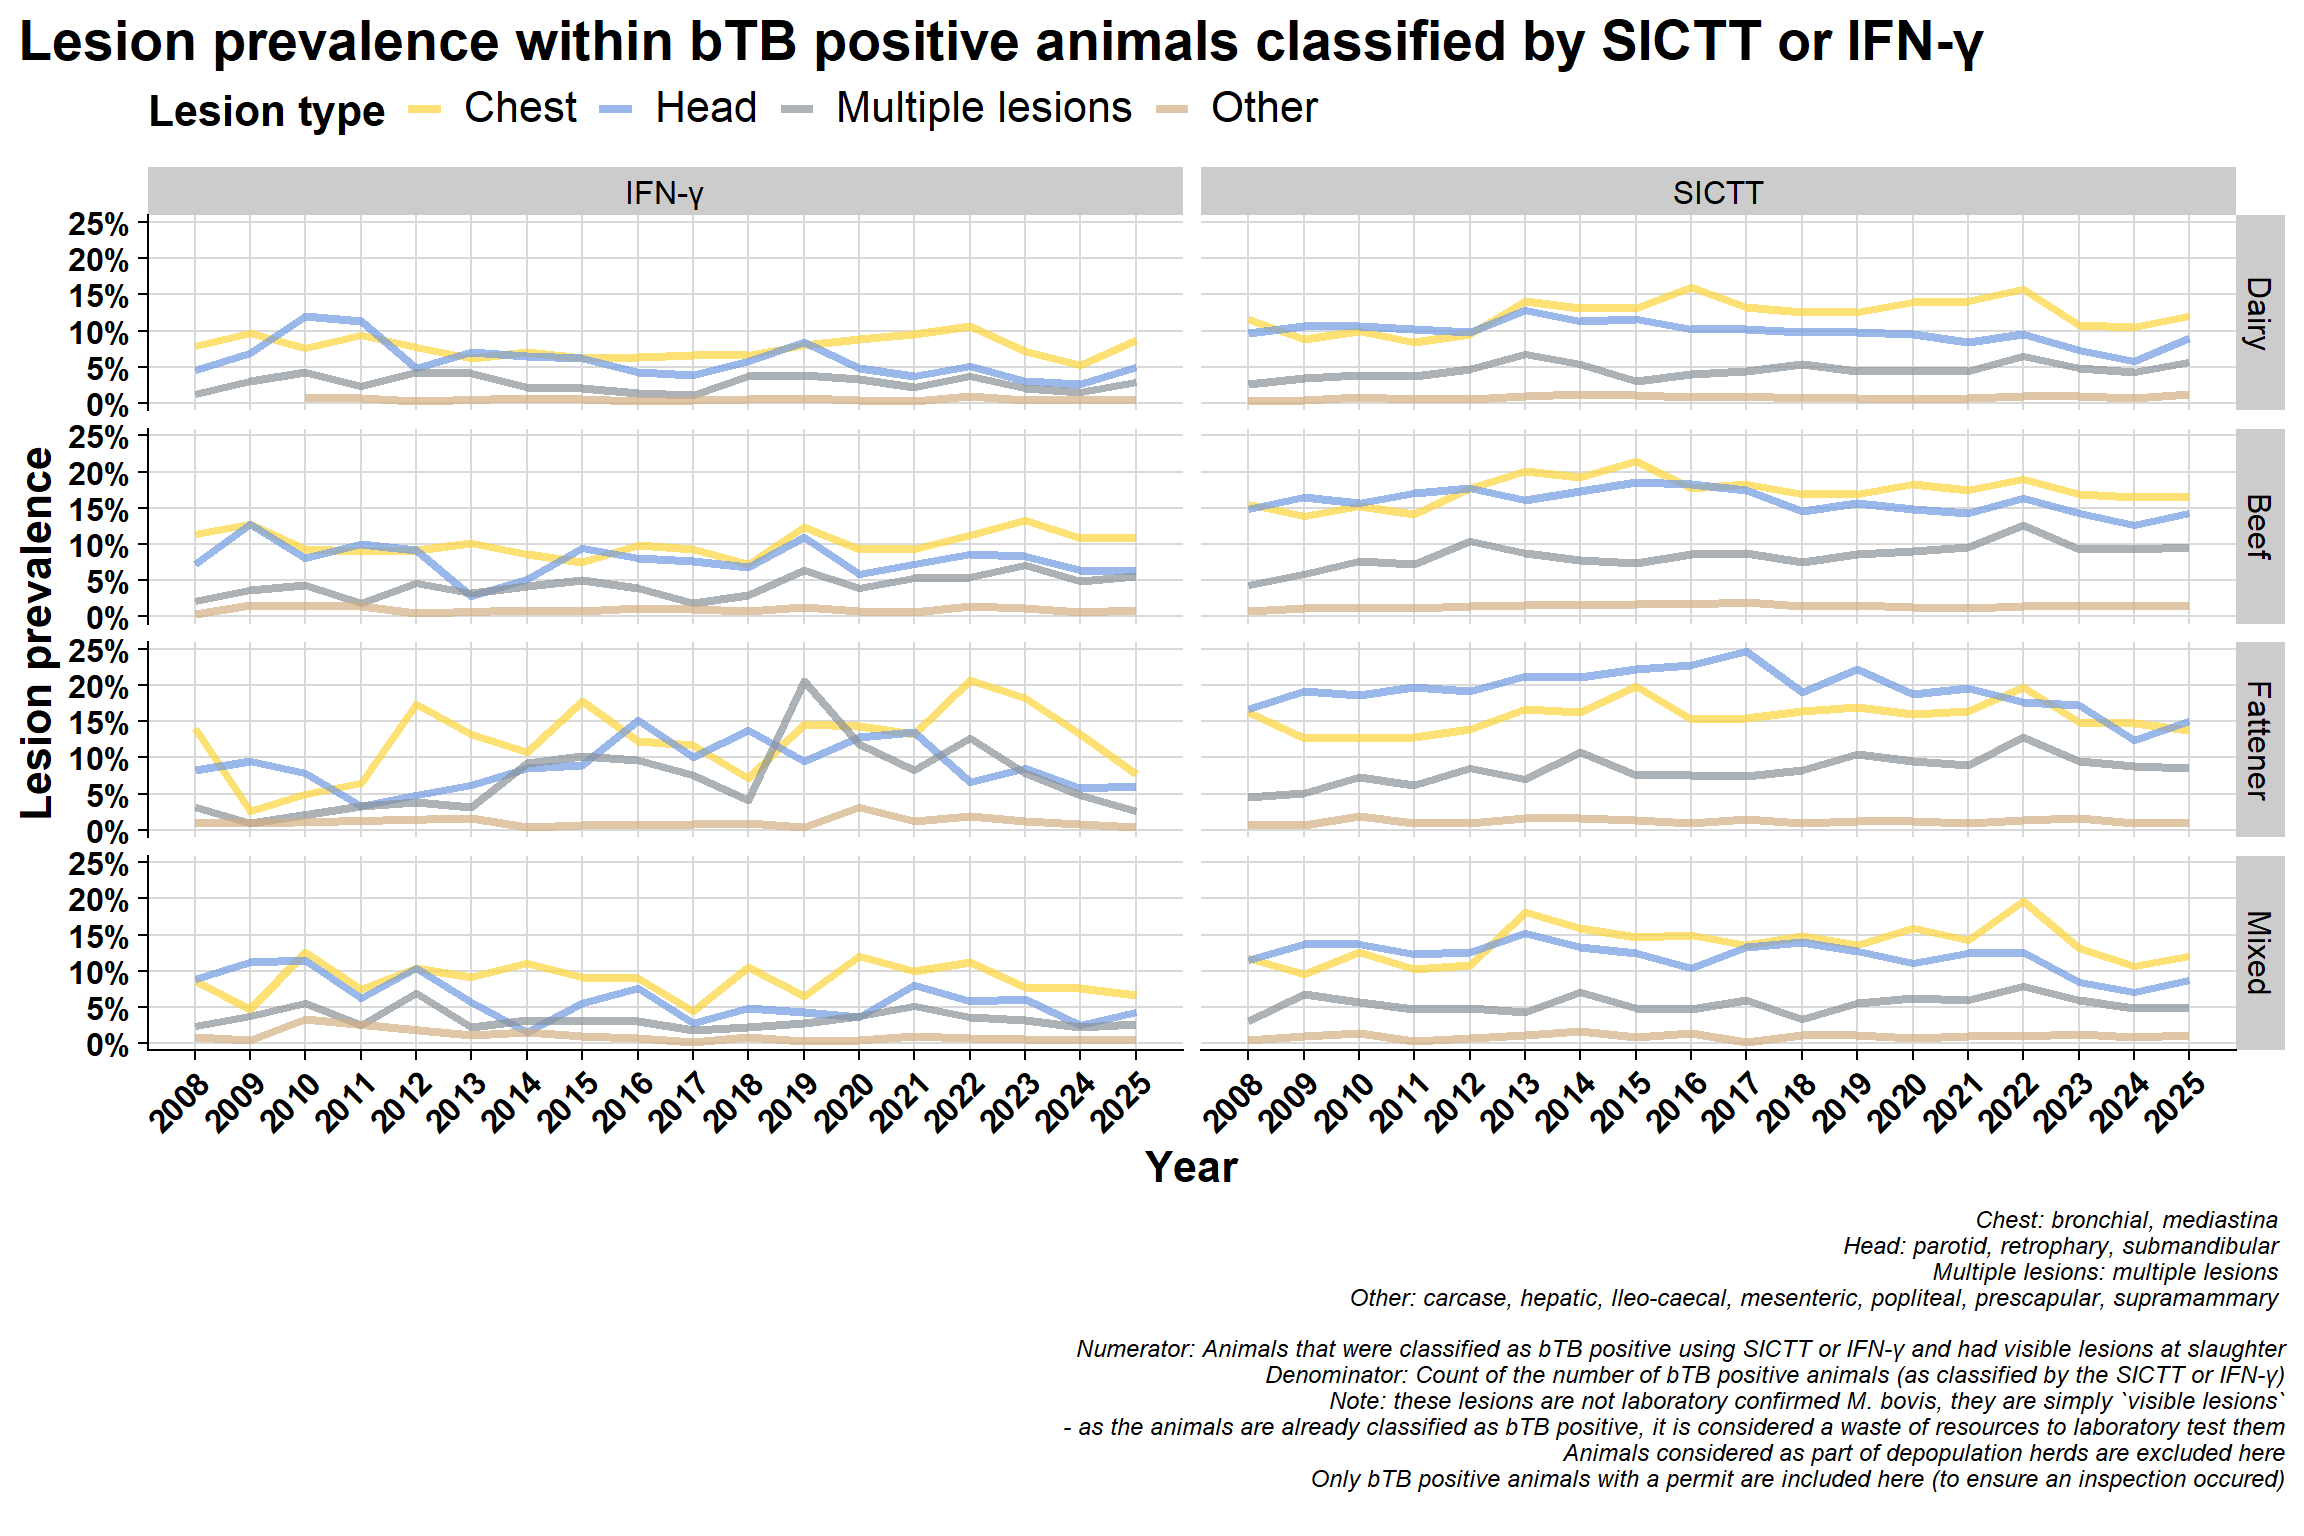
5.5 Lesion prevalence by location
The following section estimates the prevalence of SICTT or IFN-γ positive animals that have lesions at different locations in the body.
5.5.1 All animals combined:
Yearly:
\(~\) \(~\)
\(~\) \(~\)
Monthly version:
\(~\) \(~\)
\(~\) \(~\)
5.5.2 Proportion breakdown by where the lesions are found:
(of animals with lesions, what is the proportion breakdown of where they are located)
SICTT:

\(~\) \(~\)
\(~\) \(~\)
IFN-γ:
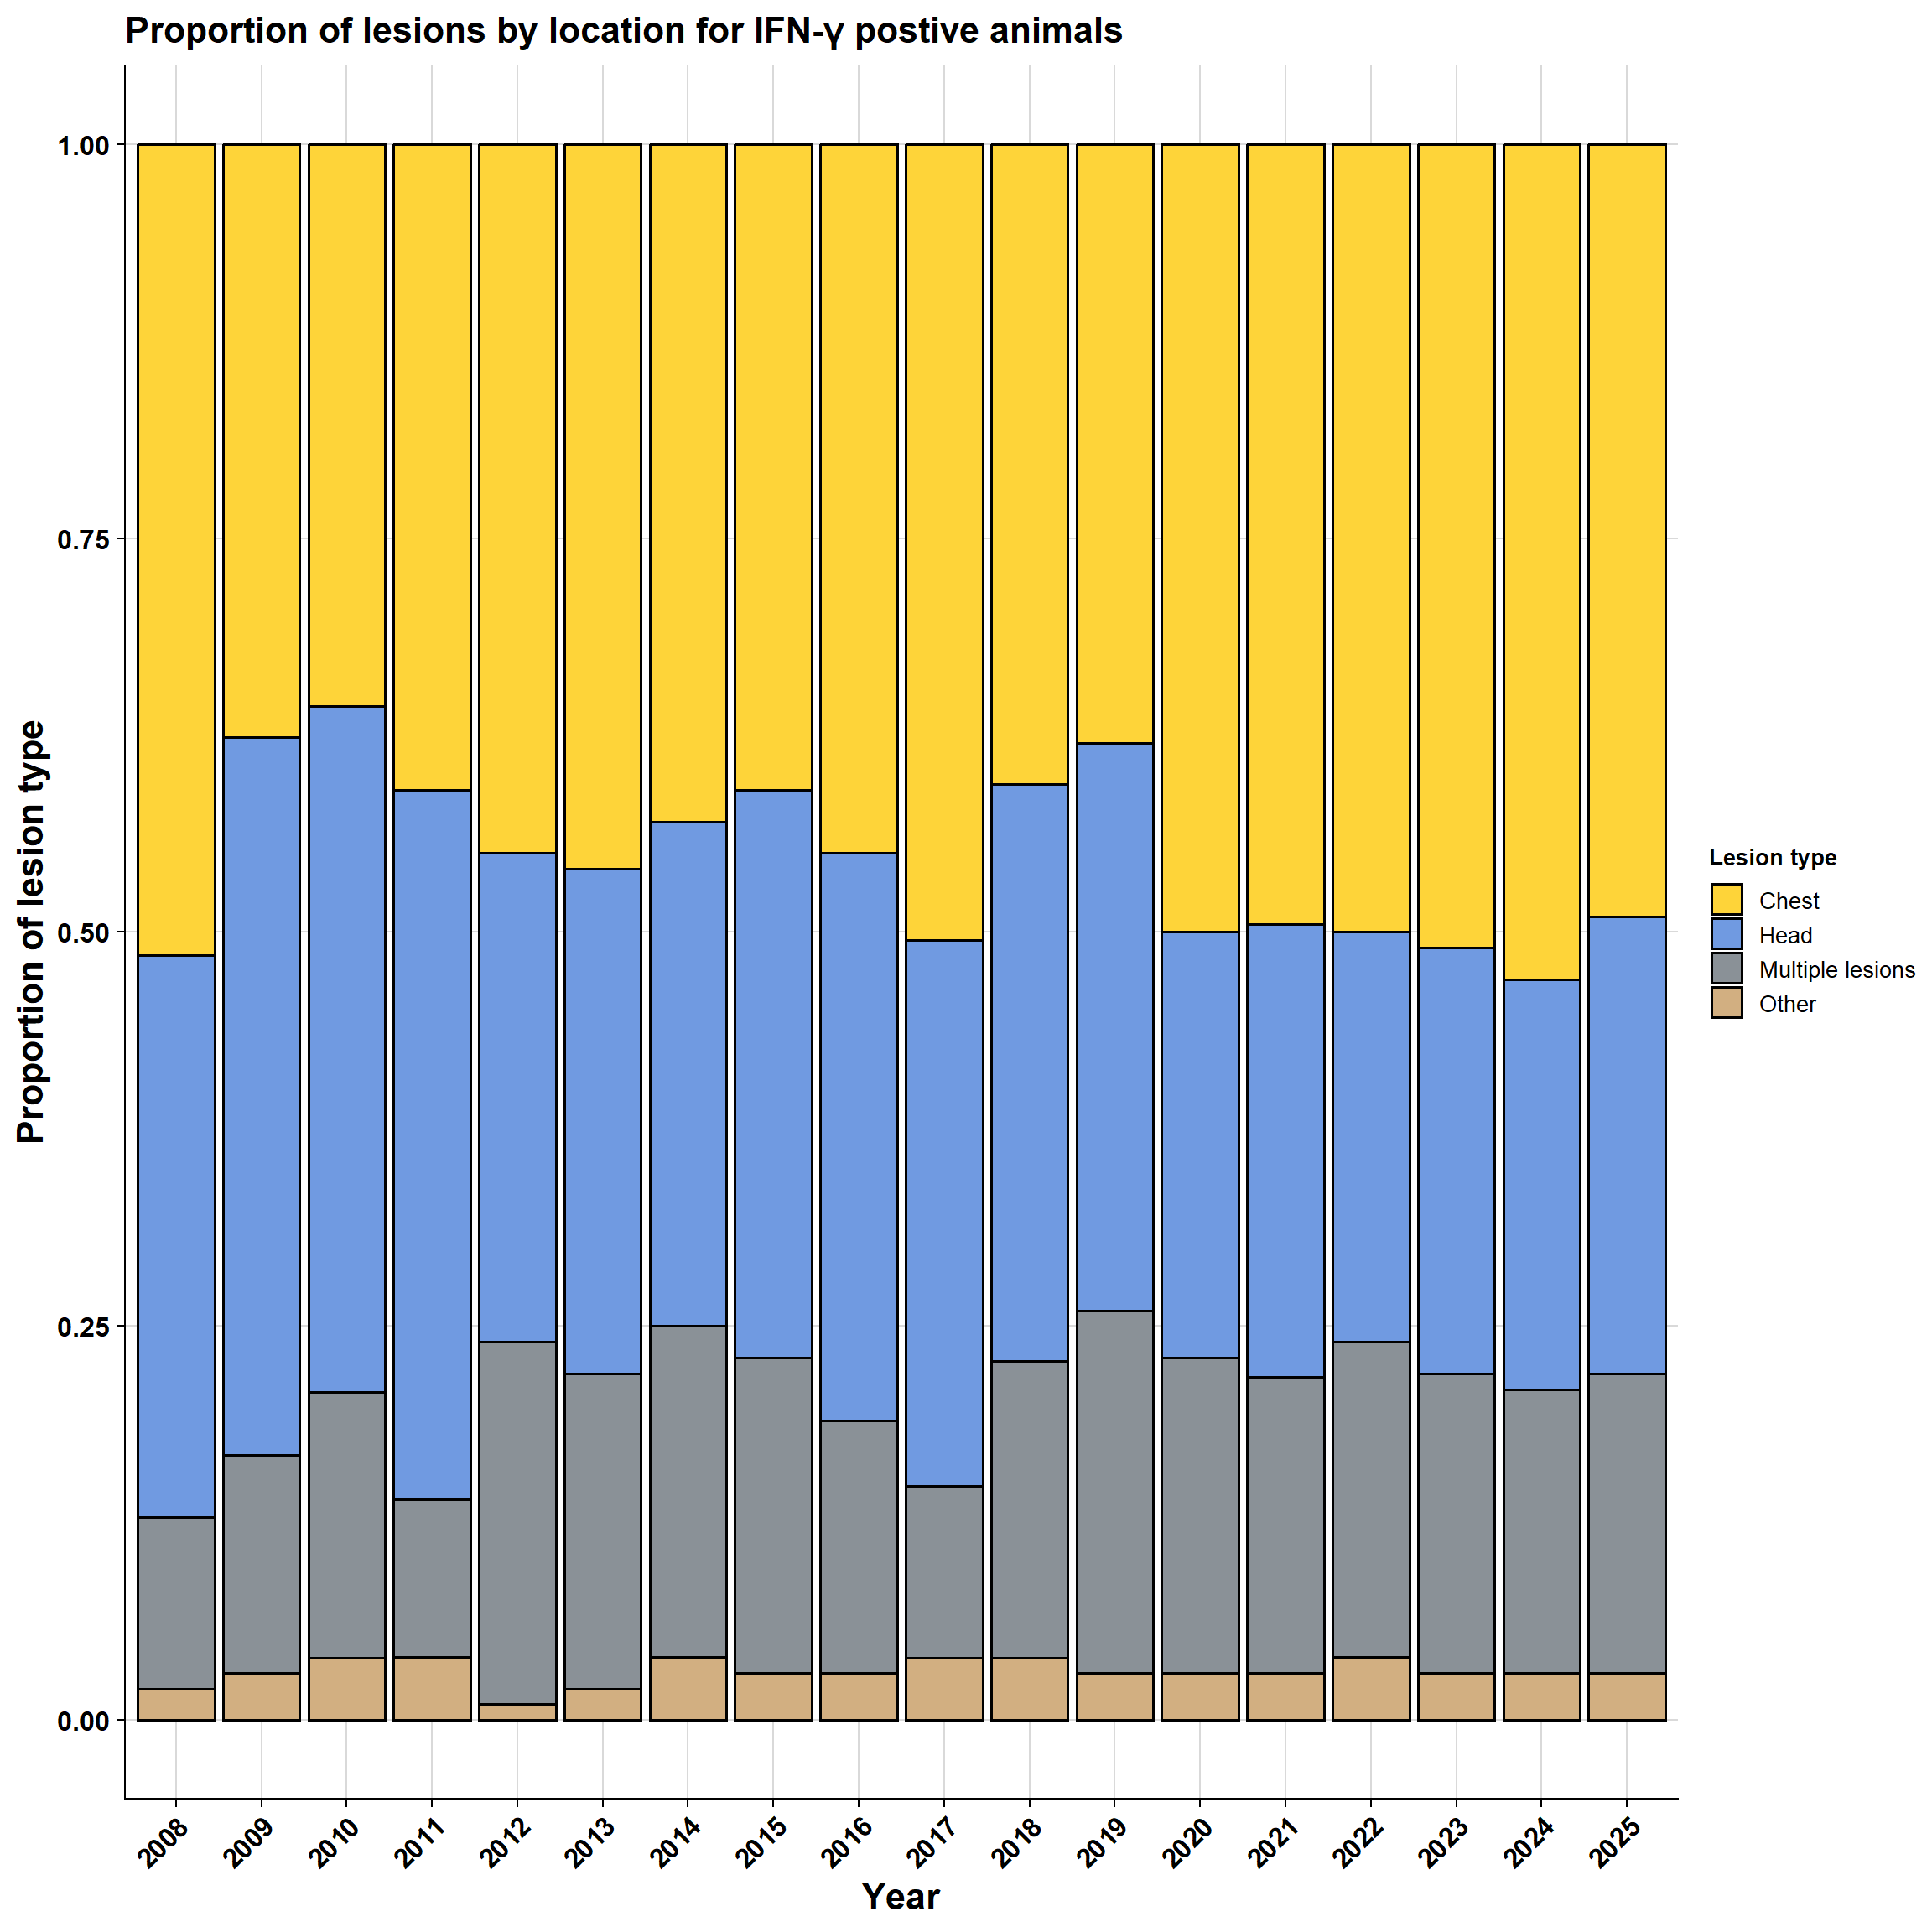
\(~\) \(~\)
\(~\) \(~\)
5.5.3 AHCS herd-types per year
\(~\) \(~\)
\(~\)
\(~\) \(~\)
\(~\) \(~\)
5.5.4 AHCS herd-types per month
\(~\) \(~\)
5.5.4.1 Interactive
\(~\)
Same plot but zoomed in for clarity (outliers due to small numbers):
\(~\) \(~\)
\(~\) \(~\)
5.5.5 Brock et al. herd-types per year
5.5.6 Brock et al. herd-types per month
\(~\) \(~\)
5.5.6.1 Interactive
\(~\)
Same plot but zoomed in for clarity (outliers due to small numbers):
5.6 Additional things to add
- Tables
- Smooth trend plots
5.7 Questions
- Investigate IFN-γ avain readings pattern.