2  Summary of main findings


\(~\) \(~\)

The website contains a lot of output and so for the purposes of a quick summary, we have extracted a couple of plots from the whole website that summarise some of the main findings - these are some of the plots included in the journal submission. Note, the most current data is not available to us for all plots.

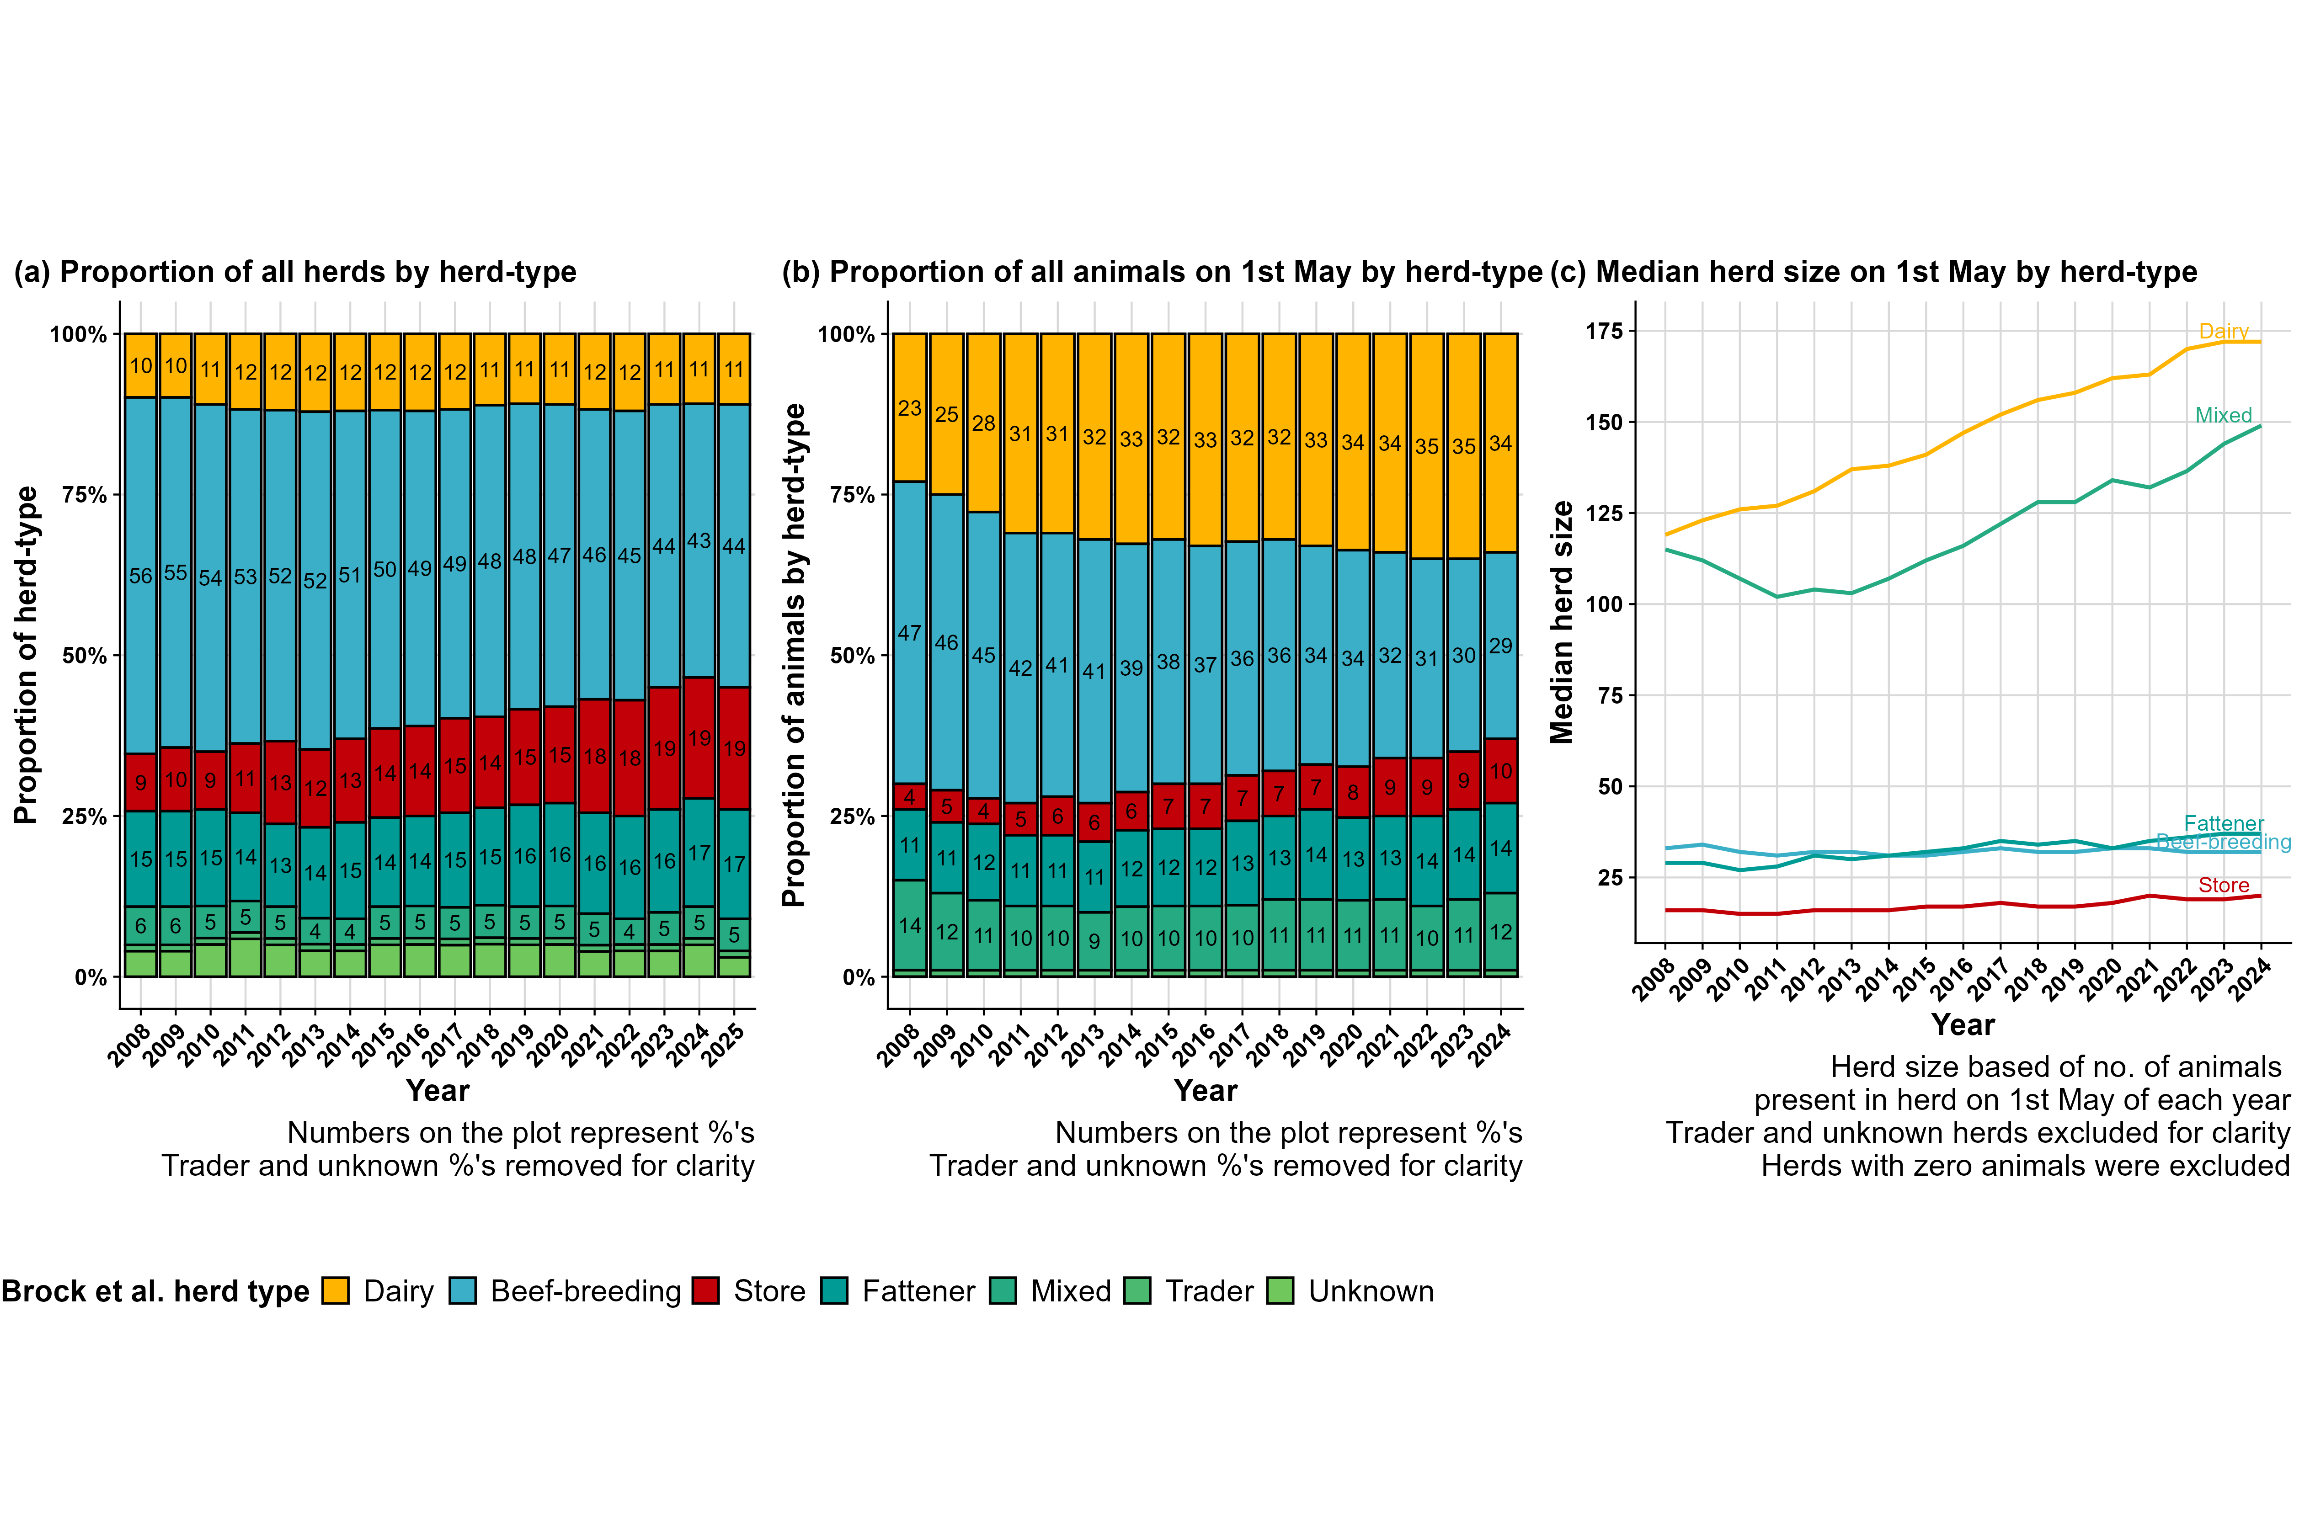
3 Demographics overview

Figure 3.1: Three main demographic characteristics from cattle in Ireland: (a) proportion of herd-types, (b) proportion of the bovine population by herd-types and (c) the median herd size by herd-type, for each year 2008-2024.

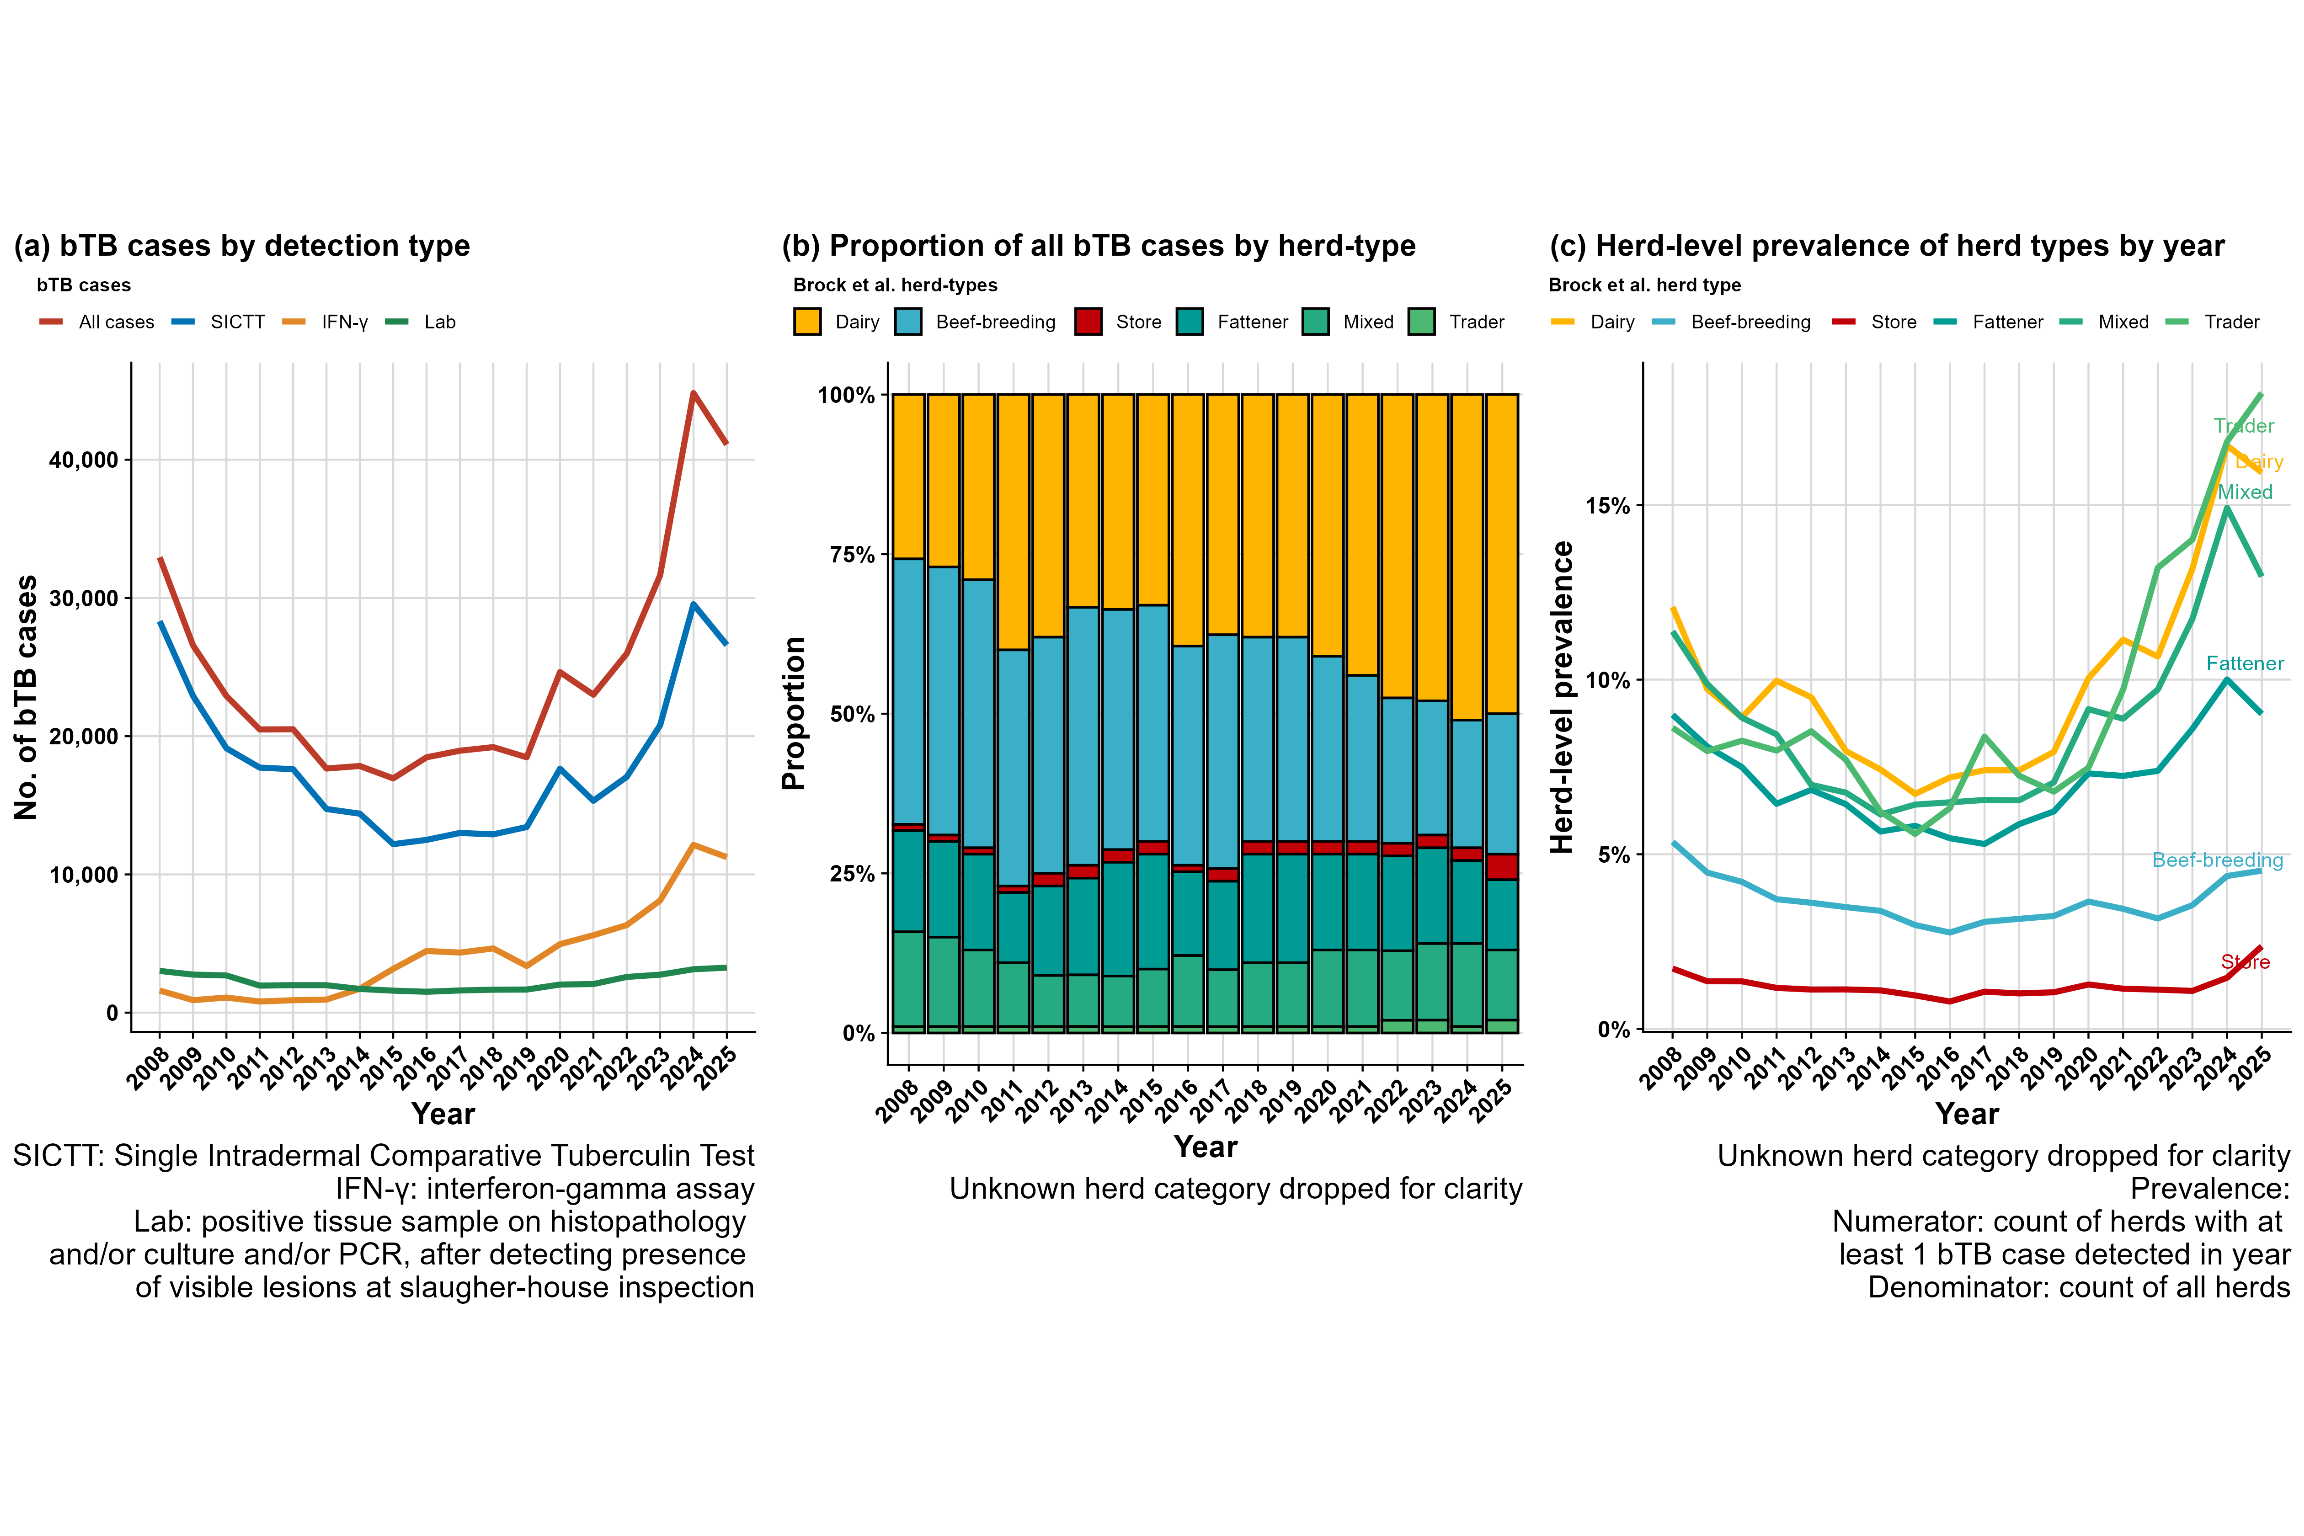
4 bTB burden overview

Figure 4.1: Three plots illustrating the burden of bTB over time and the variation between different herd-types: (a) total bTB cases by diagnostic method, (b) proportion of all bTB cases by herd-type and (c) herd-level prevalence of herd types by year.

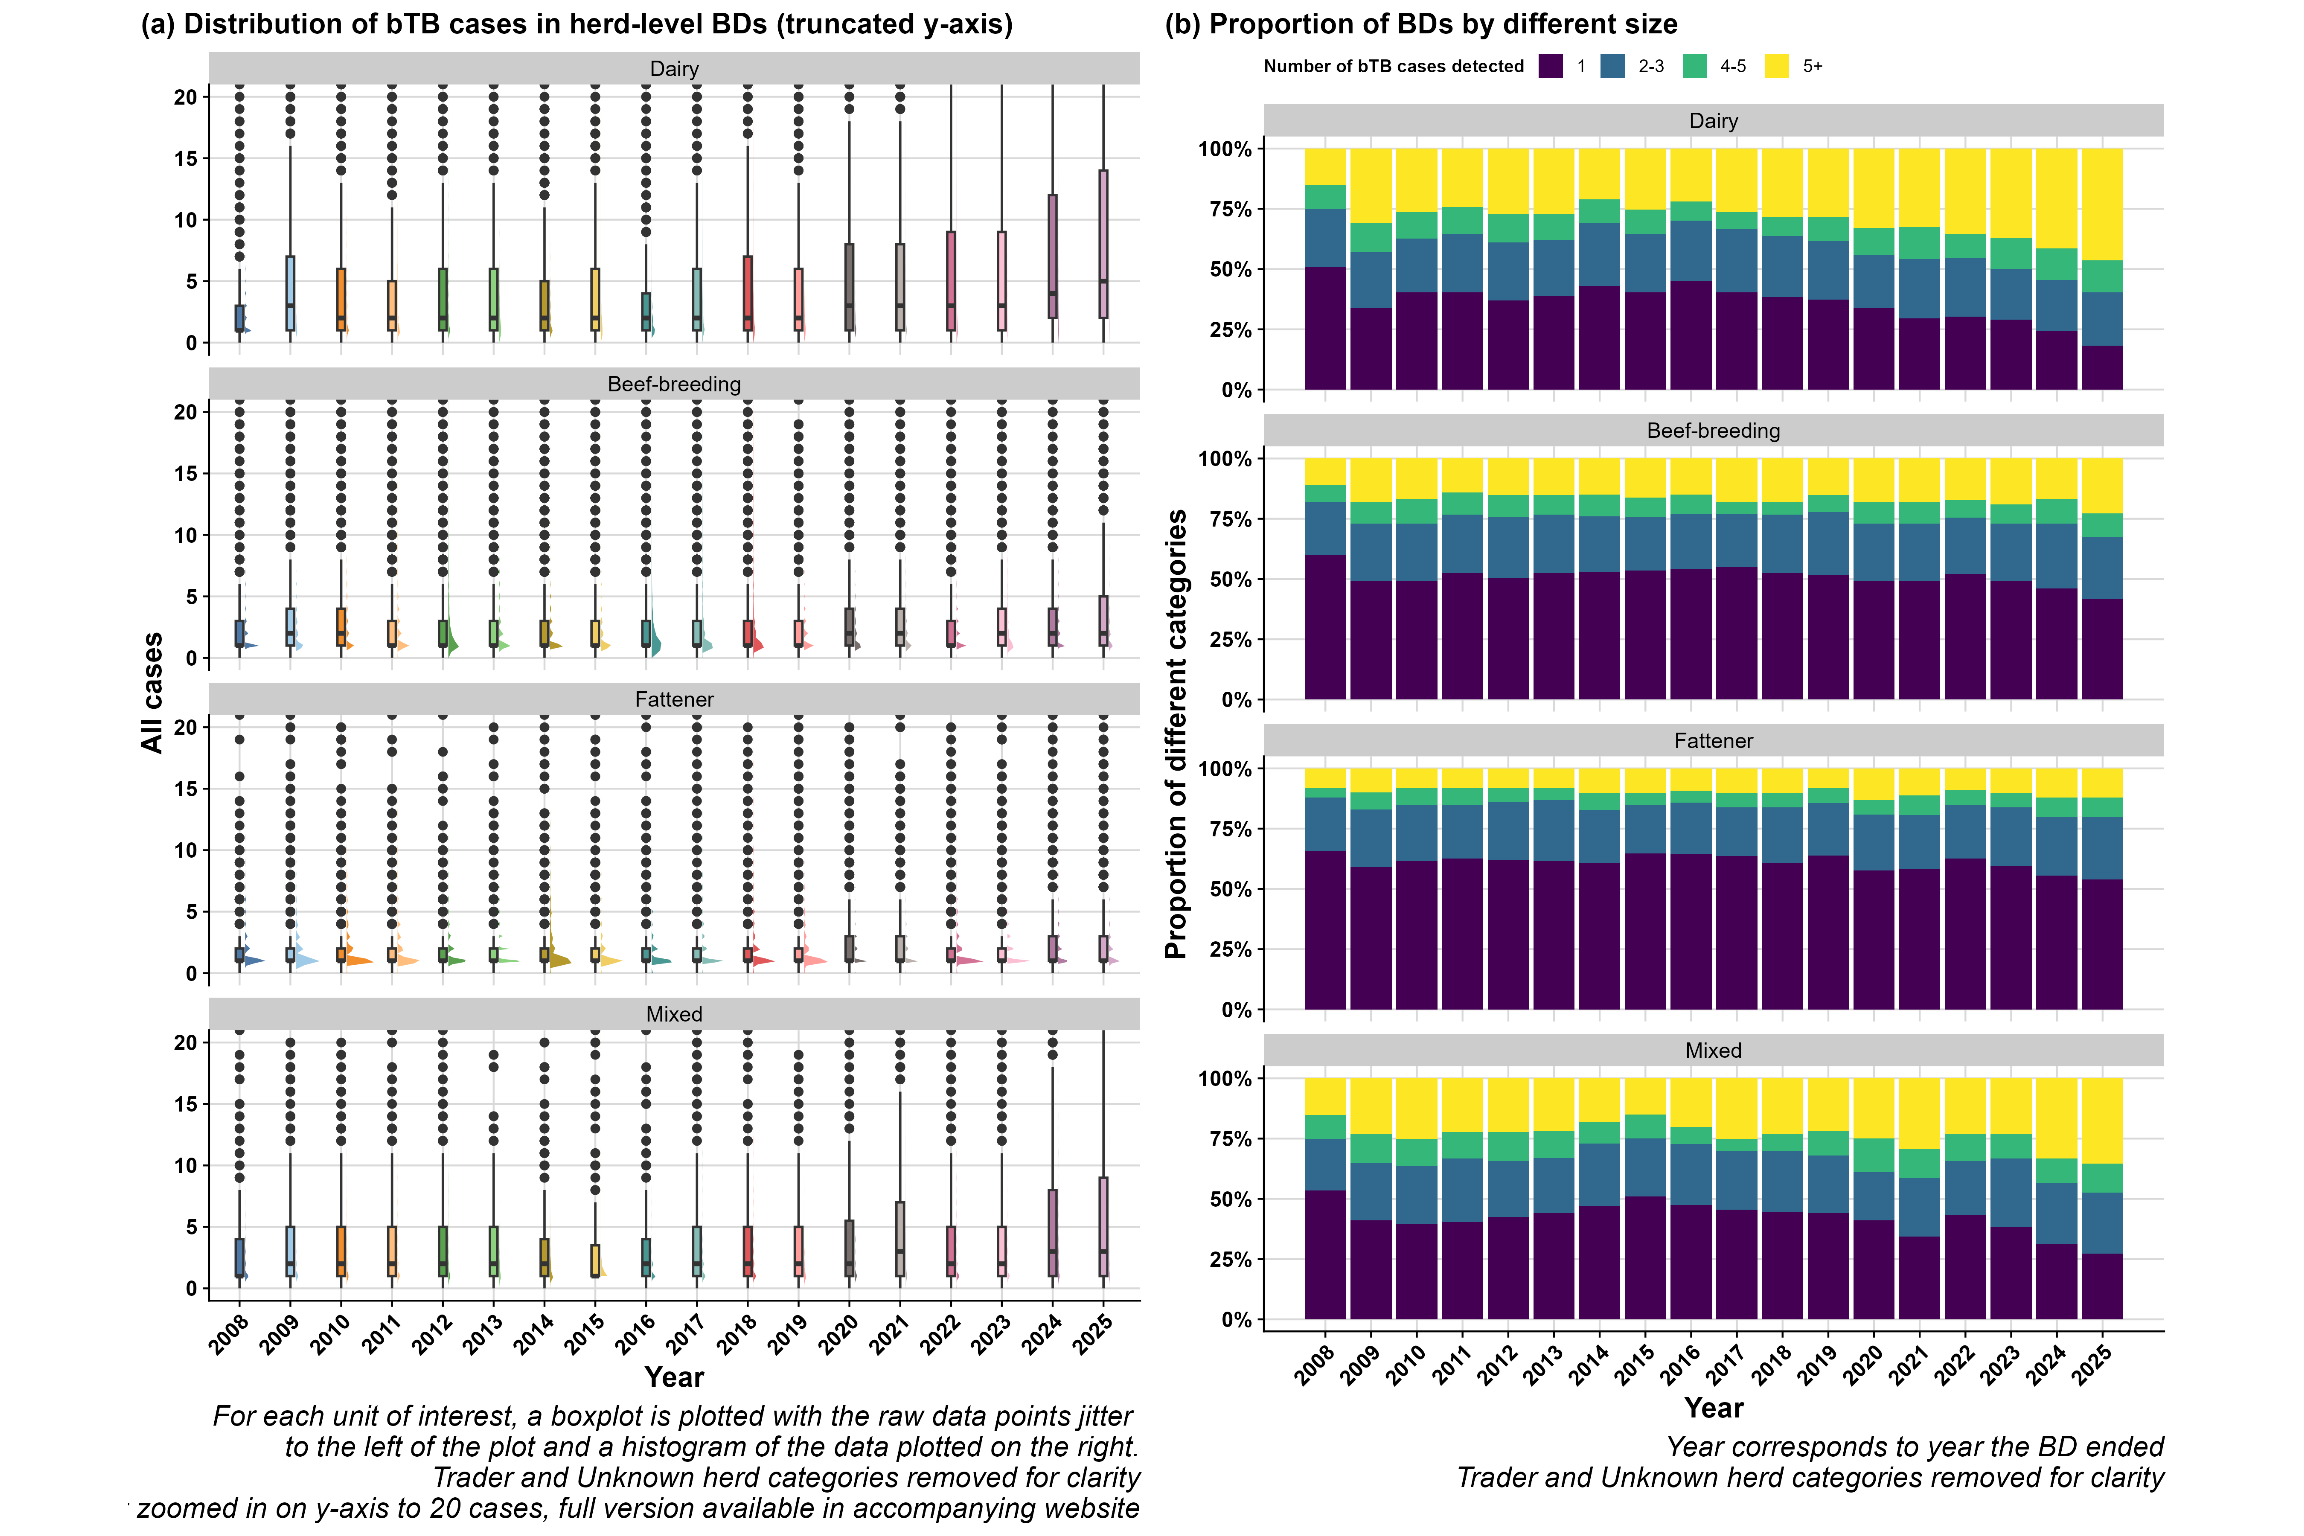
5 bTB case distribution in herd-level BDs
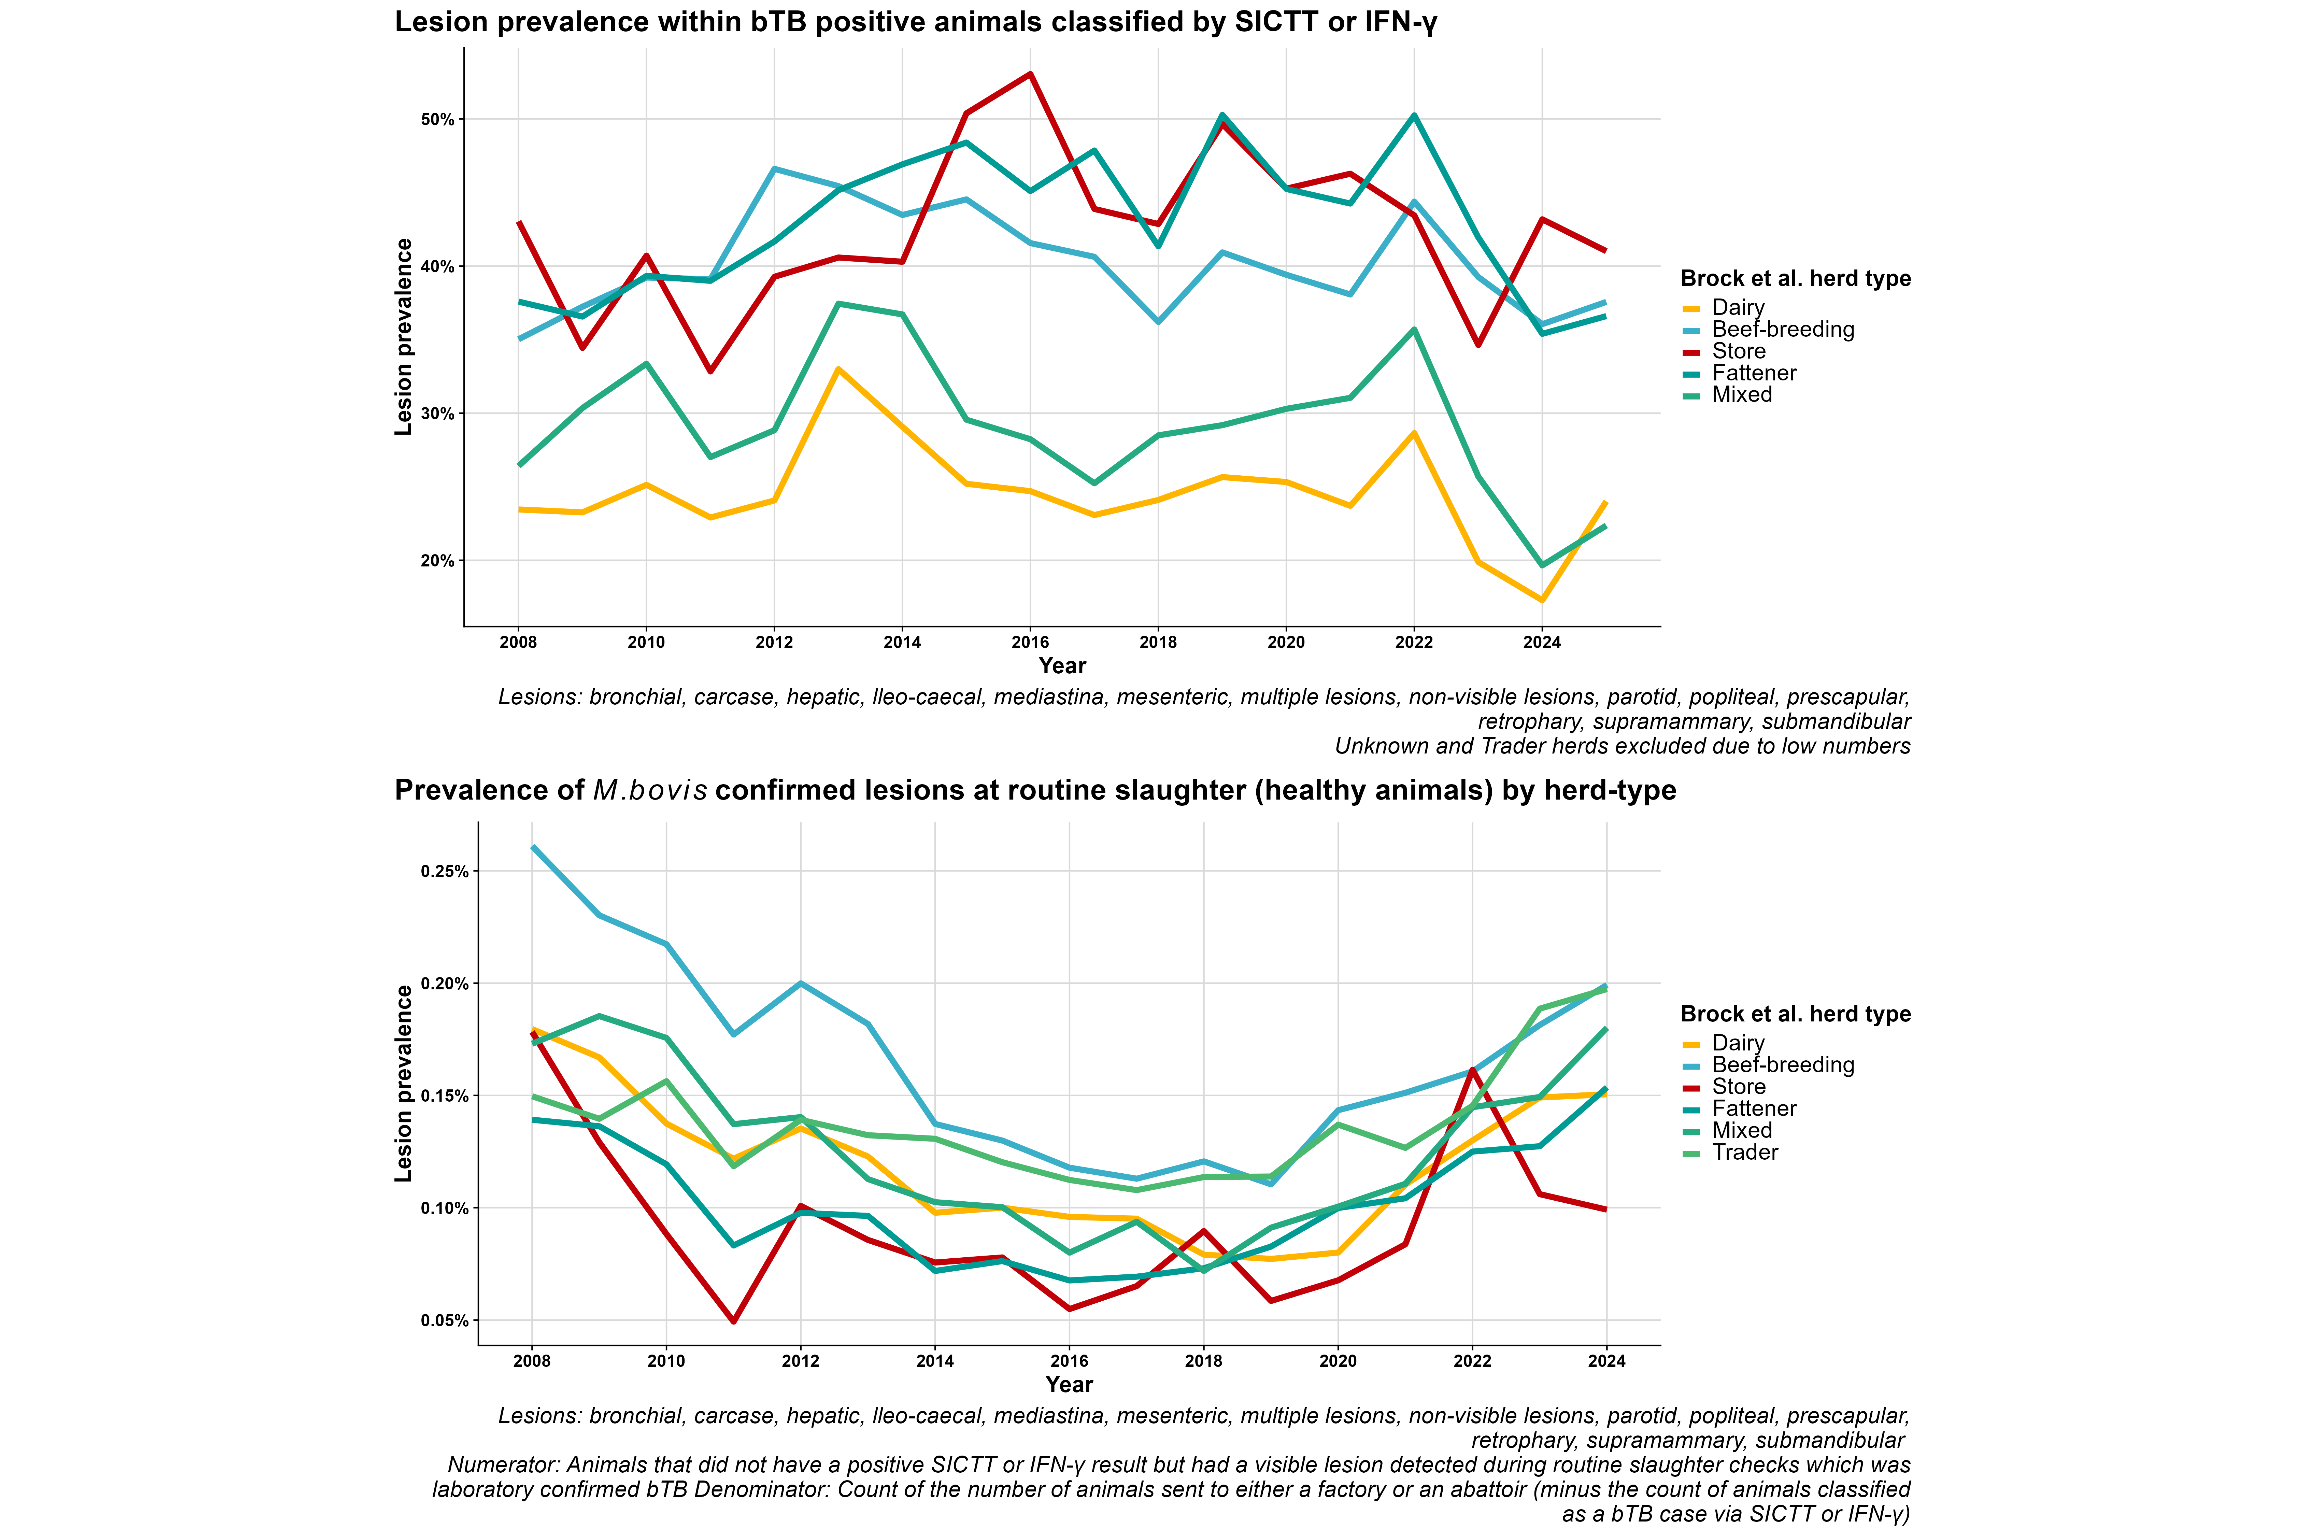
Figure 5.1: The distribution of the total number of bTB cases (via all diagnostic methods) in herd-level BDs in (a) continous form and (b) by categorizing them by different groupings of cases (1, 2-3, 4-5, 5+).

6 Lesion overview

Figure 6.1: Lesion prevalence among bTB cases (classified by SICTT or IFN-γ) and healthy animals sent to slaughter.

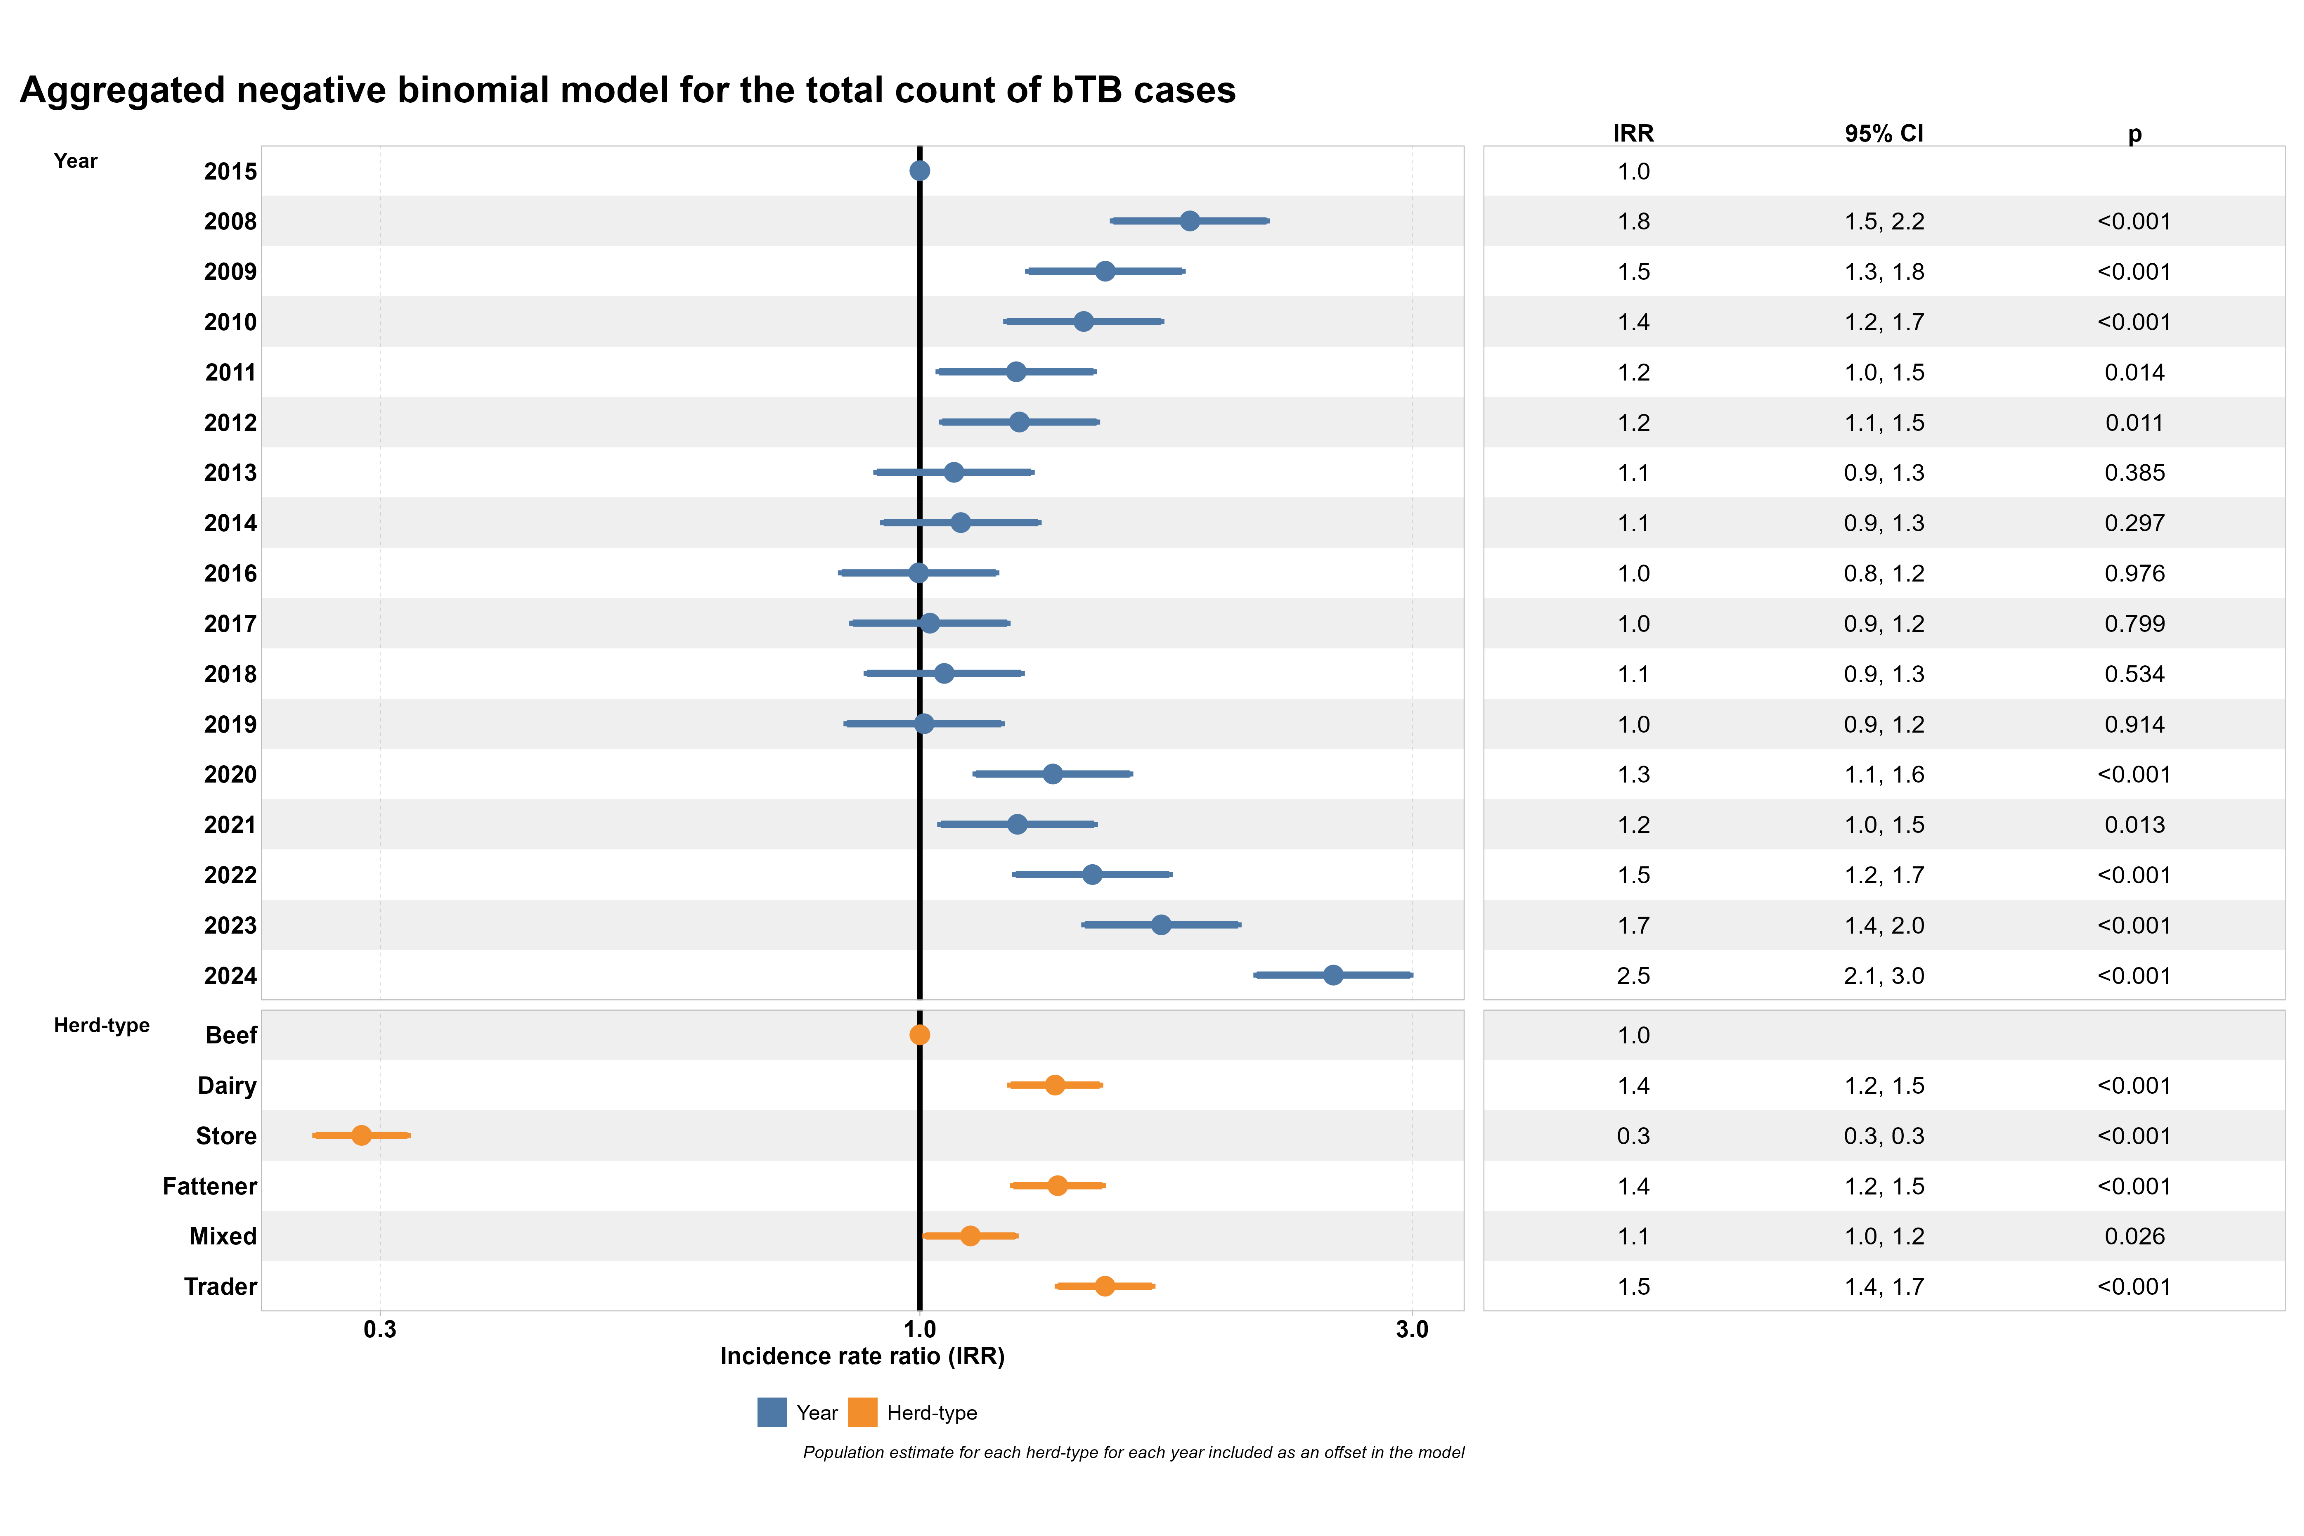
7 Aggregated case count model

Figure 7.1: Aggregated negative binomial regression model results exploring the association between year and herd-type on total count of bTB cases.